

Where Propane/LP Gas Heating Meets Housing and Income Vulnerability: October Map of the Month
By Ulrich Johanning
Home heating does not look the same across the Southeast. Some communities rely heavily on electricity or utility gas, while others make greater use of propane/liquefied petroleum (LP) gas and other delivered fuels. These patterns can reflect differences in climate, housing stock, infrastructure, fuel access, and geography. Housing type and household resources can also shape how households experience energy costs and their ability to make efficiency improvements. This month’s map examines manufactured home concentration and lower median household income as two separate lenses for understanding where high propane/LP gas heating reliance overlaps with potential energy-efficiency and affordability challenges.
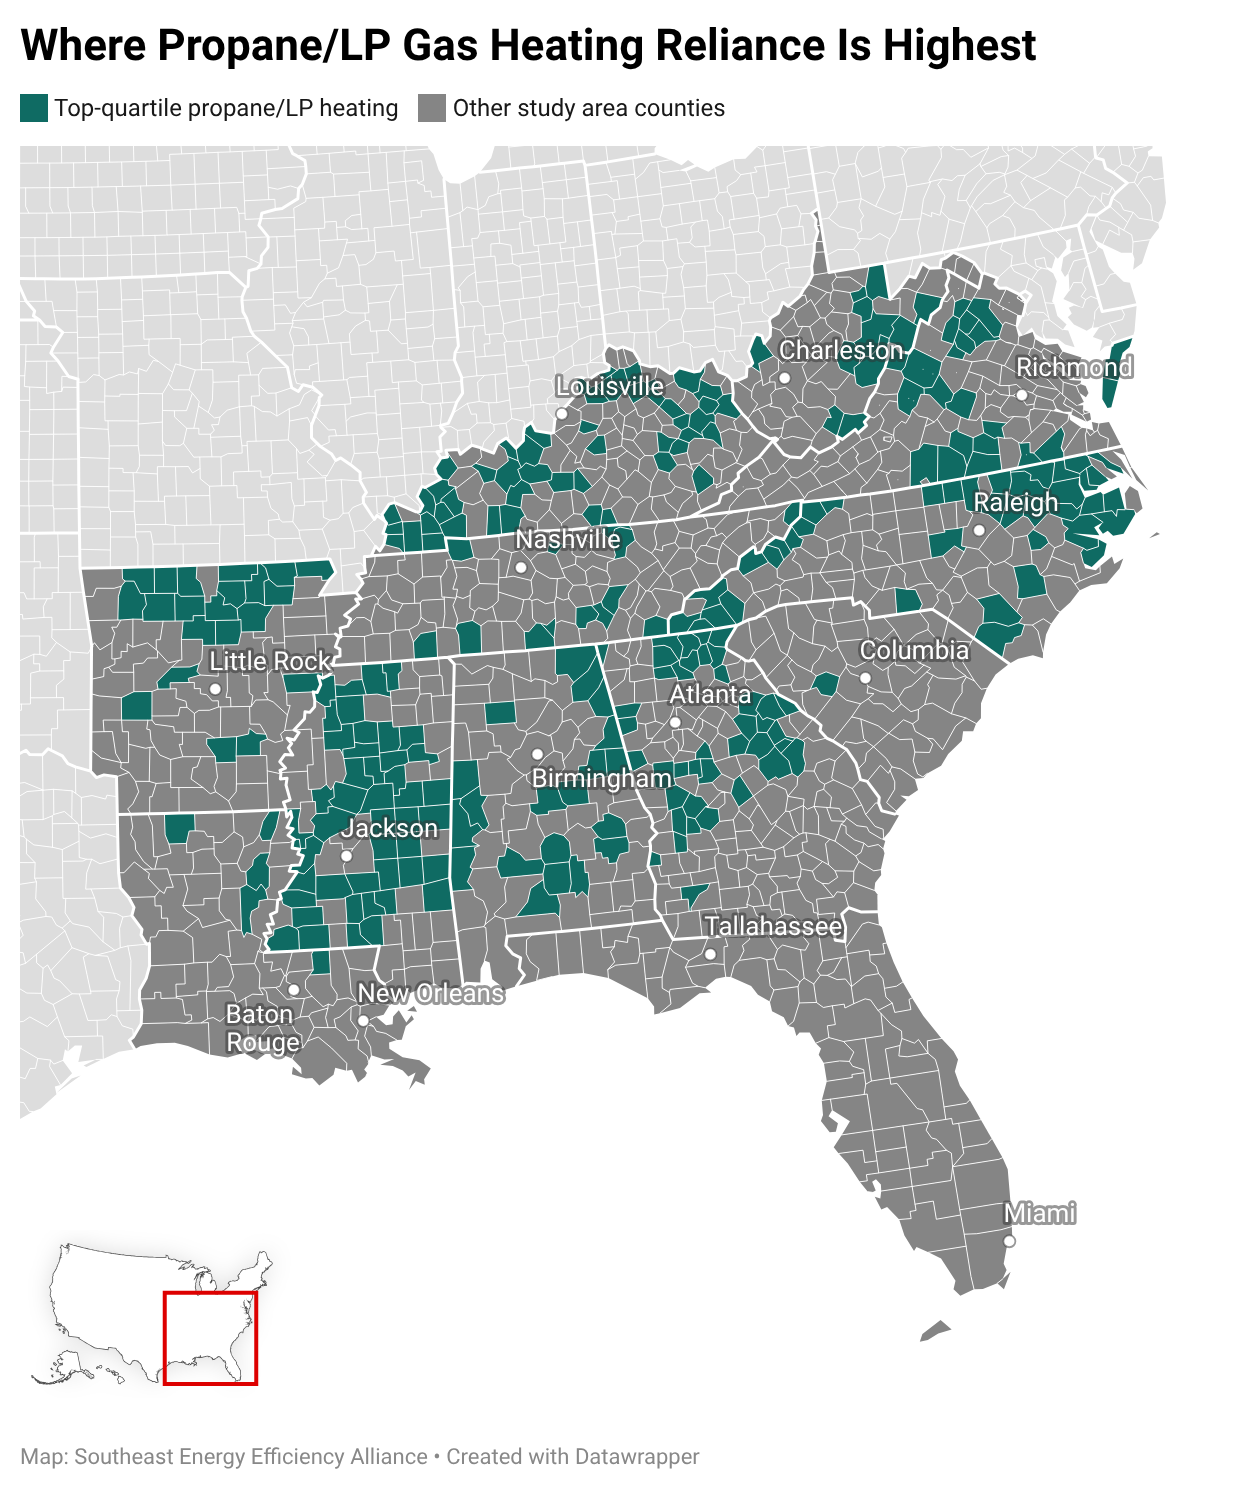
Using 2024 American Community Survey five-year estimates, the analysis covers 1,063 counties and county-equivalents across 12 Southeastern states. Three county-level measures are used: the share of occupied housing units using bottled, tank, or LP gas as their primary heating fuel; the share of housing units classified by the U.S. Census as mobile homes; and median household income. Counties are screened using regional quartiles: the top quartile for propane/LP heating and manufactured home share and the bottom quartile for median household income. These thresholds are relative measures within the 12-state study area rather than formal definitions of vulnerability. The analysis identifies county-level geographic overlap rather than household-level relationships; a household using propane/LP gas in a highlighted county is not necessarily lower-income or living in a manufactured home. The ACS measure also captures a household’s primary heating fuel rather than all propane/LP gas use.
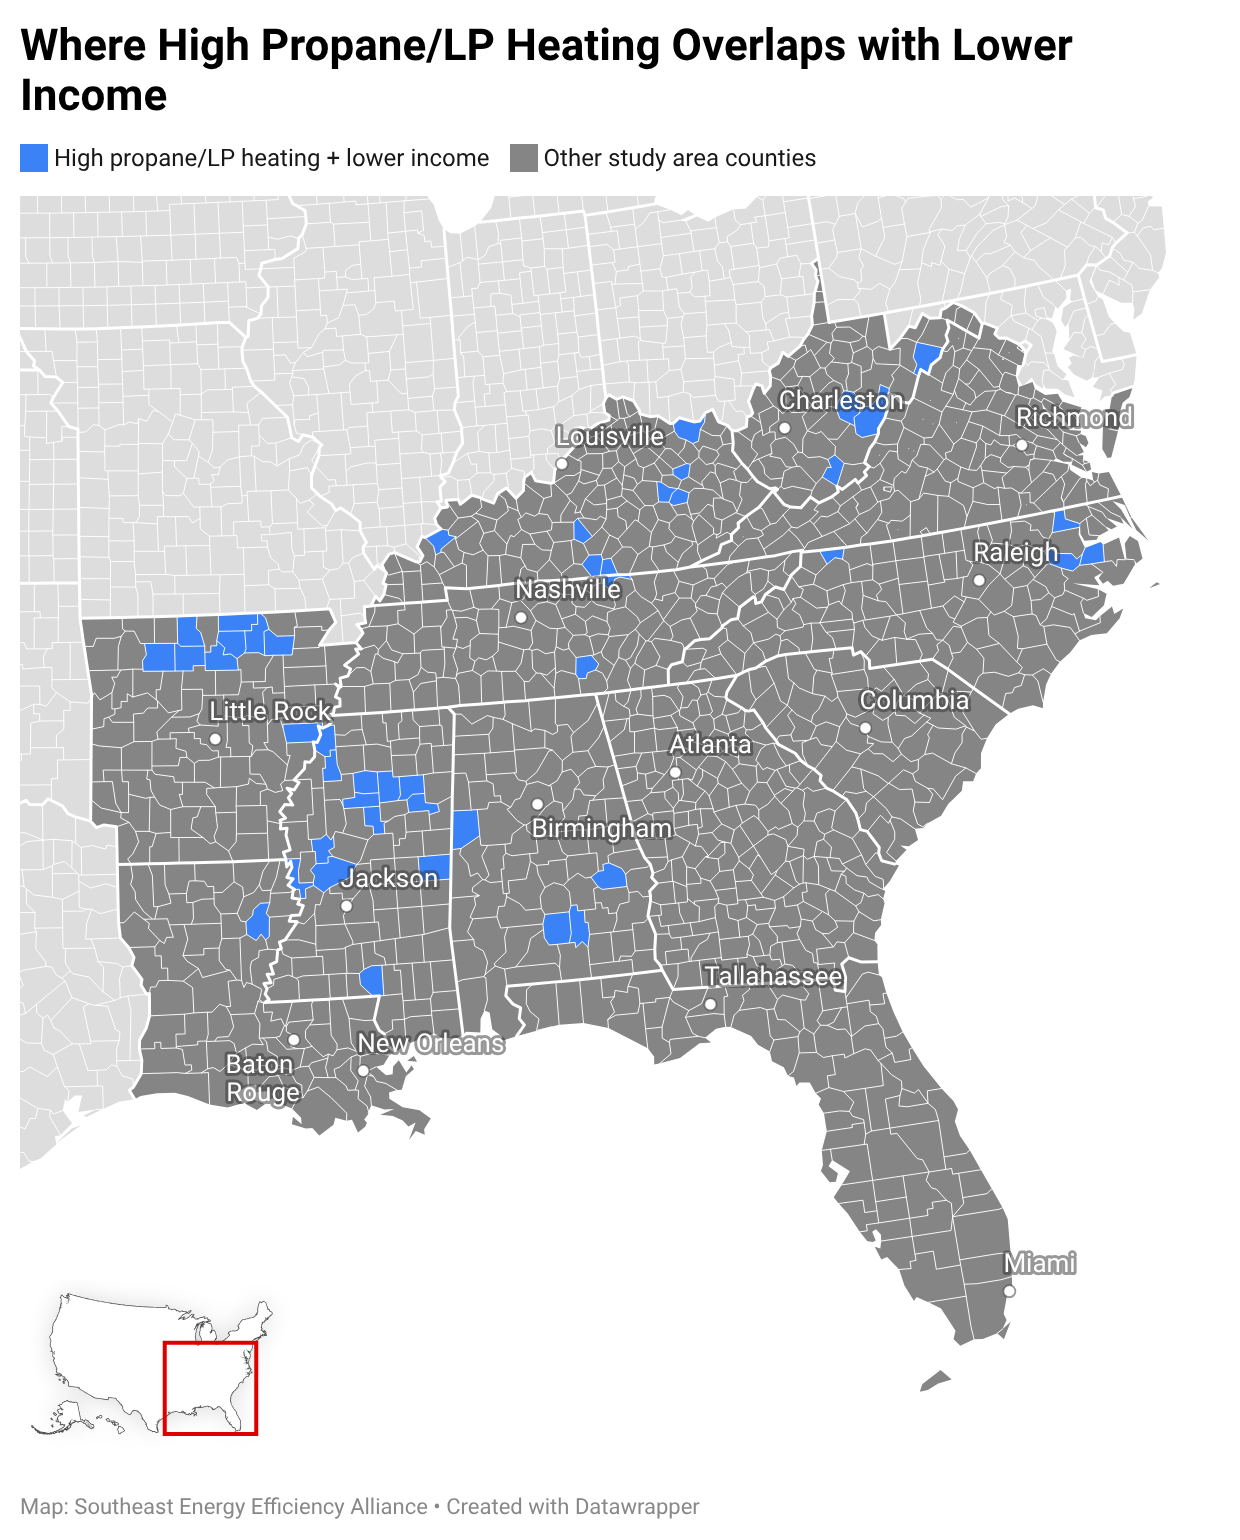
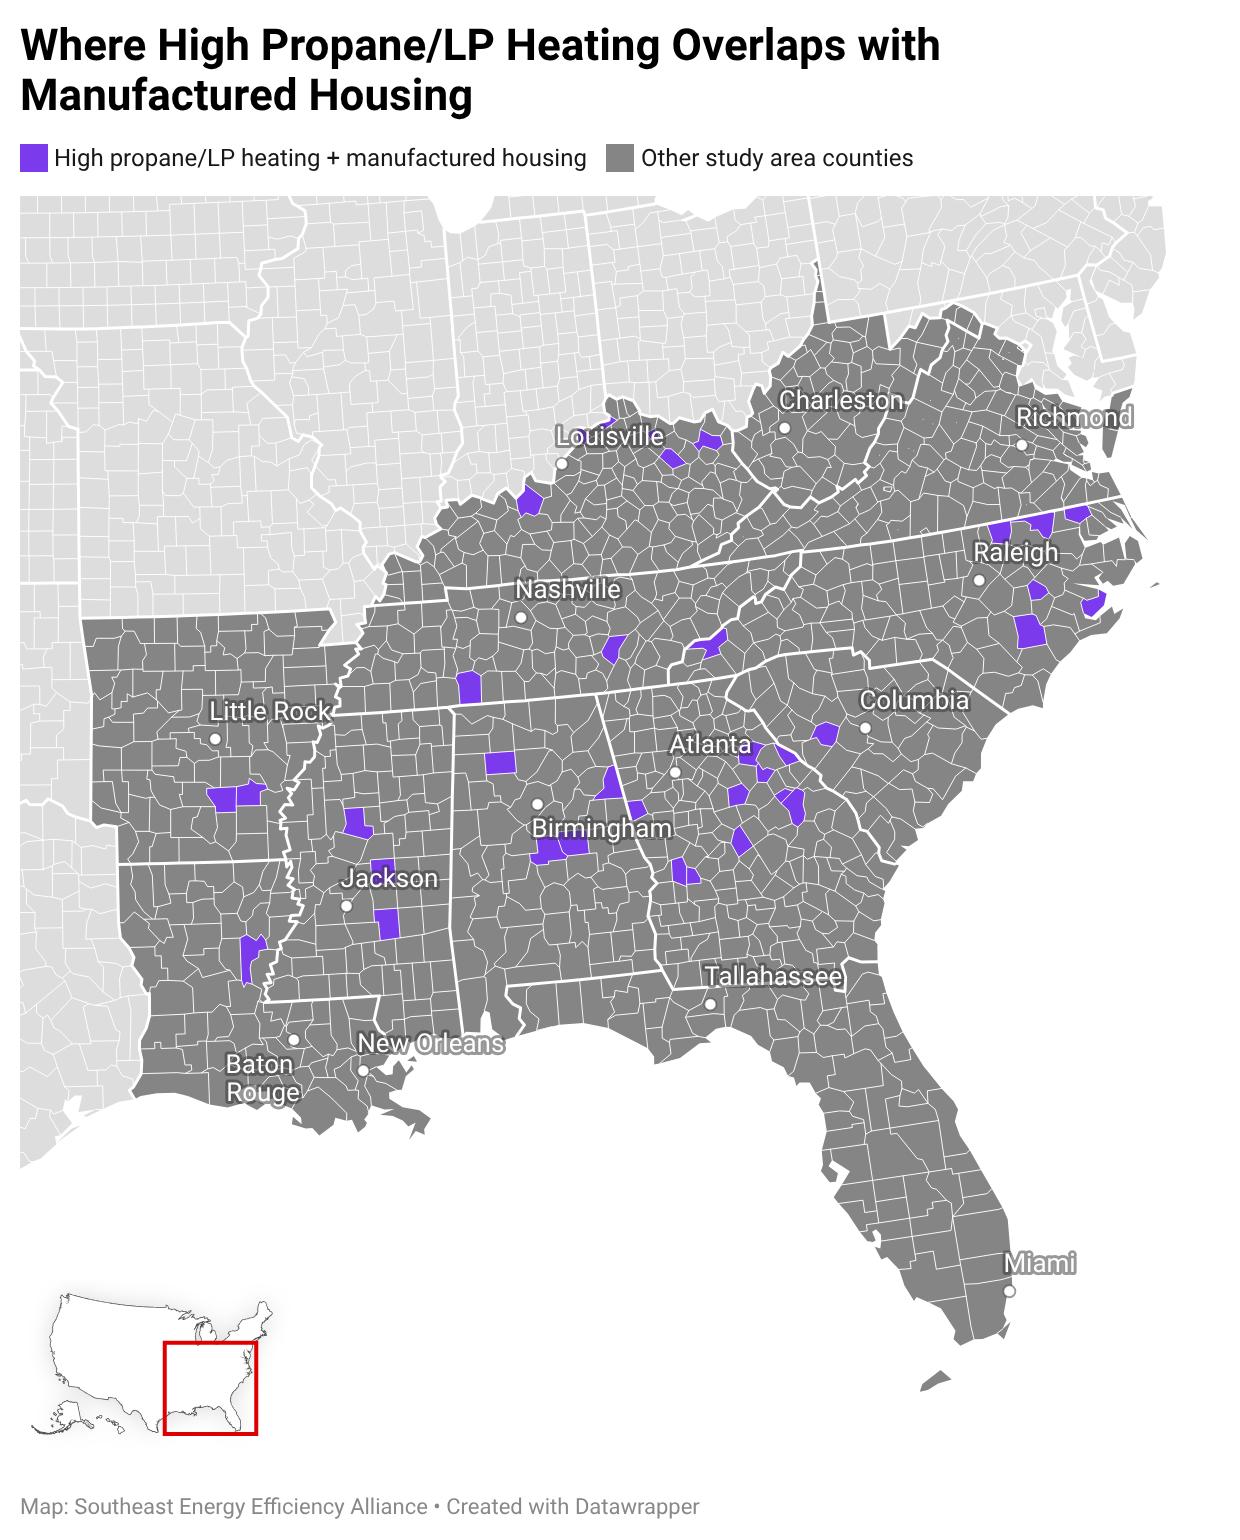
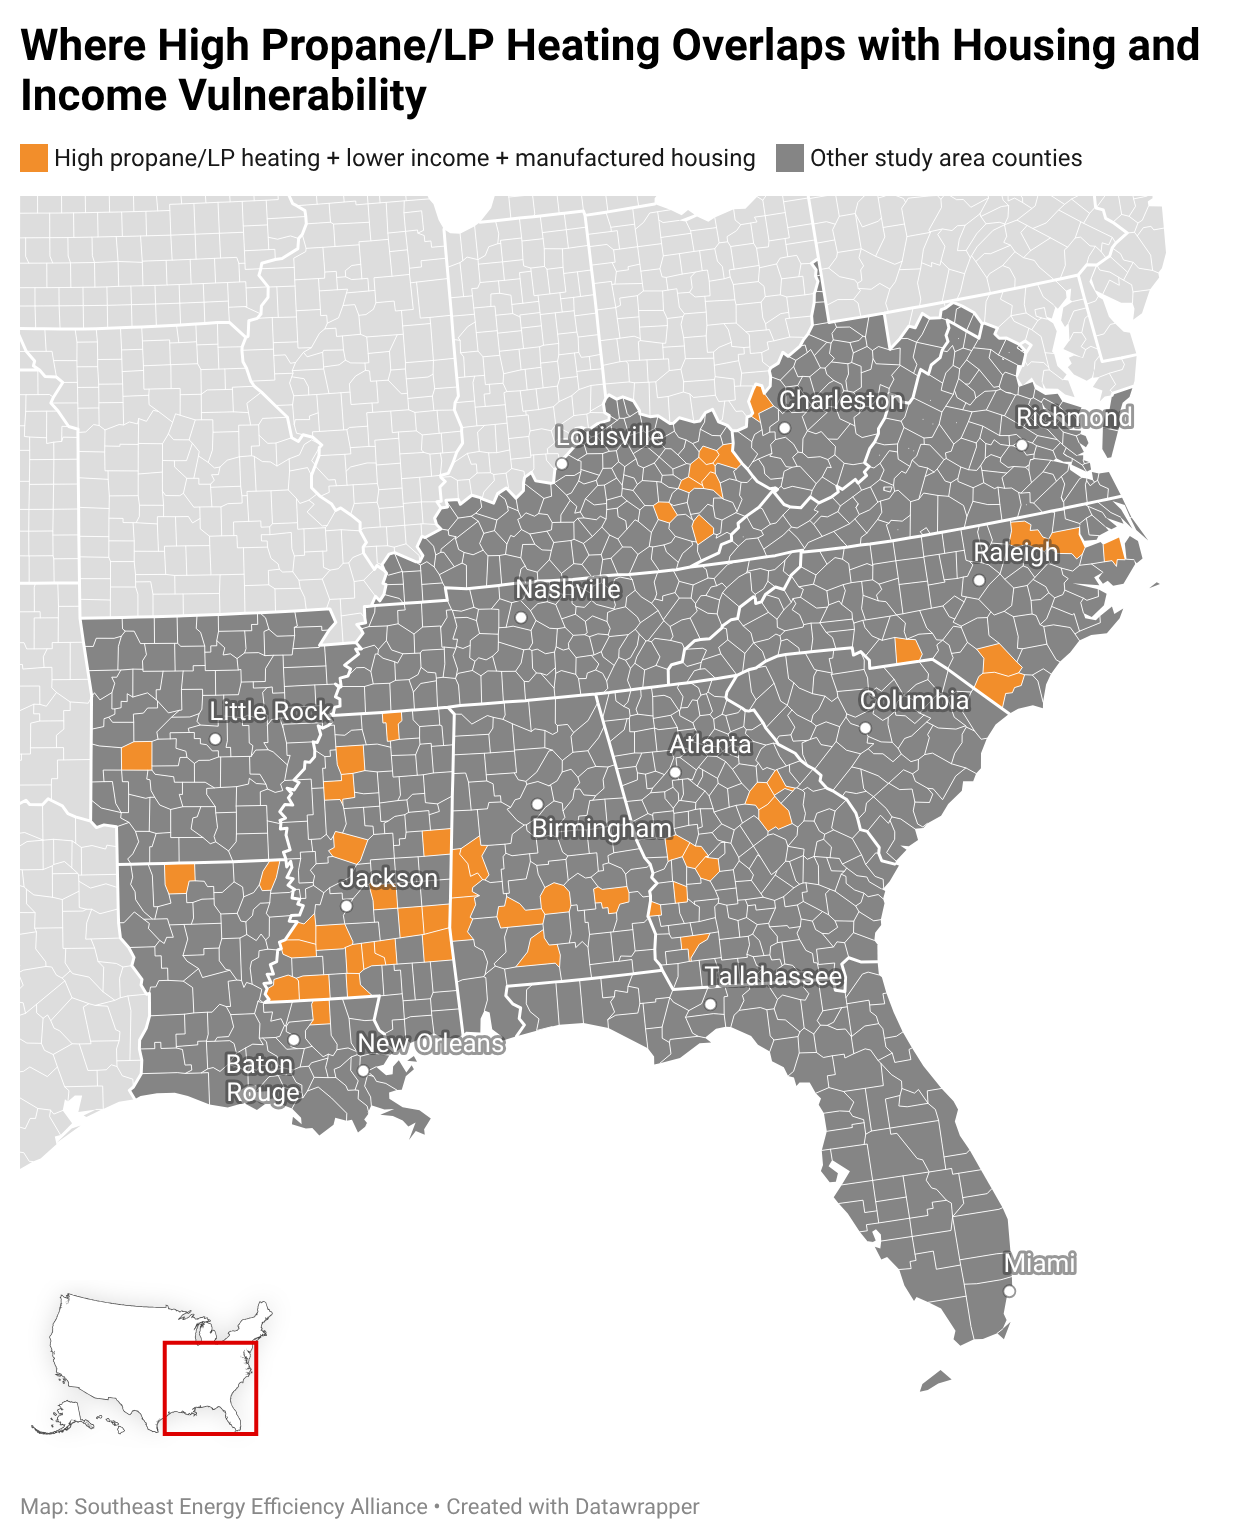
Across the Southeast, 266 counties fall into the top quartile for propane/LP heating. Half of them—133 counties—also meet at least one additional criterion: 45 overlap with lower income only, 36 with high manufactured home share only, and 52 meet all three thresholds. The geography is highly uneven. Mississippi shows the strongest concentration, while Arkansas shows more overlap with lower income and Georgia more overlap with manufactured housing. Eastern North Carolina and eastern Kentucky also form visible clusters.
The contrasts help explain why those housing and income measures should remain separate. Mississippi’s counties with high propane/LP gas heating reliance are overwhelmingly rural, and local natural-gas distribution is uneven, making rurality and fuel access plausible contributors to its pattern. Florida, by contrast, has no counties in the regional high-propane/LP gas quartile; EIA data show that electric heating and all-electric homes are especially common there. Virginia presents a different case: it has 22 counties with high propane/LP gas heating reliance, but none cross either the regional lower-income or high-manufactured-housing threshold. Those counties are still highly rural, showing that rural propane/LP gas use for heating does not automatically coincide with the same housing or income characteristics in all states.
Georgia and Arkansas reinforce the lack of regional trends. Georgia’s overlap is more visible through manufactured housing, while Arkansas’s is more visible through lower median household income, including a cluster in northern Arkansas. Together, these patterns suggest that the geography of propane/LP gas heating interacts differently with housing stock and household resources across the Southeast rather than following a single regional profile.
Lower-income households and manufactured homes can shape energy-affordability and efficiency challenges in different ways. DOE defines a high household energy burden as spending at least 6% of gross income on home energy costs; nationally, low-income households average roughly three times the energy burden of non-low-income households.
Housing conditions matter separately. EIA’s 2024 Residential Energy Consumption Survey shows elevated energy insecurity among households living in manufactured homes and among households reporting poor or no insulation. These patterns do not mean manufactured housing itself causes energy insecurity, but they reinforce the importance of housing condition and vintage when considering efficiency opportunities.
Resilience adds another element. During long power outages, households may depend on backup generation to maintain heating, cooling, refrigeration, communication, medical, and other essential services. Propane/LP gas can support these systems because fuel can be stored on-site and used in generators when grid power is out. PERC also notes that propane can be stored for long periods without degrading in the way diesel or gasoline do. Recent PERC research points to growing household concern about outage preparedness, while DOE similarly identifies distributed generation and backup power as tools for improving energy resilience.
The practical implication is that the same efficiency intervention may not face the same barriers everywhere. In counties where propane/LP gas heating overlaps with lower incomes or manufactured housing, upfront costs, housing condition, equipment type, local energy infrastructure, contractor access, retrofit feasibility, and program eligibility may shape whether households can participate in or benefit from efficiency improvements.
Geography matters because households that use propane/LP gas for heating do not face the same housing, income, or infrastructure conditions everywhere. Some counties show clear overlap with lower incomes or manufactured housing, while others do not. These maps can serve as a launching point for understanding those differences more closely—and for asking what weatherization, equipment replacement, contractor access, outreach, or other efficiency strategies may make the most sense locally. What additional local barriers or opportunities might these maps help uncover? And how could that knowledge shape more effective energy-efficiency efforts?