Month: February 2024
NSPM 101: Evaluating Costs & Benefits of Energy Efficiency Investments from the Regulator’s Perspective
Lily Smith

Conducting Benefit-Cost Analysis for Energy Efficiency and Other DERs
How much energy efficiency should utilities deliver? This question is the subject of discussion among many stakeholders, including utilities, public service commissions, ratepayers, and others interested in maintaining a clean, reliable, affordable energy system. Undoubtedly, a variety of perspectives contribute to this answer – one of them is understanding the costs and benefits of energy efficiency programs. For decades, most utilities and commissions have relied on the California Standard Practice Manual – guidance established forty years ago – to evaluate the costs and benefits of energy efficiency programs from different stakeholder perspectives, including program participants, utilities, a ‘total resource’ perspective, and even society. However, up until recently, there has been no approach that evaluates energy efficiency investments from the energy regulator’s perspective – the entity making final decisions about energy efficiency programs, budgets, and related issues.
The National Standard Practice Manual (NSPM)
In 2017, the National Standard Practice Manual for Assessing Cost-Effectiveness of Energy Efficiency Resources (NSPM for EE) was published by the National Energy Screening Project. This manual provided a framework for cost-effectiveness testing with a focus on energy efficiency. In 2020, the National Standard Practice Manual for Assessing the Cost-Effectiveness of Distributed Energy Resources (NSPM for DERs, or NSPM) was developed (expanding on the NSPM for EE) to account for other DERs—demand response, distributed generation (e.g., rooftop solar, combined-heat power), distributed storage, electric vehicles and building electrification. The NSPM for DERs supplants the earlier EE version.
The NSPM for DERs is policy-neutral and employs the use of economically sound principles, concepts, and methodologies for both single and multi-DER analysis to help guide the development of jurisdictions’ cost-effectiveness test(s) for conducting benefit-cost analyses (BCAs) of DERs.
Unique to the NSPM is that it fills the gap by proposing a regulatory perspective to support the development of a jurisdiction’s primary cost-effectiveness test, which the NSPM refers to as a ‘Jurisdiction-Specific Test’ (JST). The NSPM provides eight foundational guiding principles and a multi-step process for developing a JST.
NSPM BCA Principles
The NSPM for DERs builds on traditional cost-effectiveness tests by focusing on the regulatory perspective, where a core principle is to ensure alignment with the jurisdiction’s applicable energy policies. Such an alignment may influence the inclusion (or exclusion) of certain impacts (benefits and costs) included in the test. As such, a state’s JST may (or may not) align with one of the traditional cost tests, as this will depend on the state’s specific policies. Further, the NSPM principles emphasize the importance of ensuring consistency across DERs and regulatory mechanisms for measuring cost-effectiveness to avoid bias in resource investment decisions. The NSPM can help states create a consistent BCA framework for valuing the full range of DERs. Policymakers are encouraged to design a BCA guided by the NSPM BCA Principles below.
Table 1. NSPM BCA Principles
| Principle 1 | Treat DERs as a Utility System Resource DERs are one of many energy resources that can be deployed to meet utility/power system needs. DERs should therefore be compared with other energy resources, including other DERs, using consistent methods and assumptions to avoid bias across resource investment decisions. |
| Principle 2 | Align with Policy Goals Jurisdictions invest in or support energy resources to meet a variety of goals and objectives. The primary cost-effectiveness test should therefore reflect this intent by accounting for the jurisdiction’s applicable policy goals and objectives. |
| Principle 3 | Ensure Symmetry Asymmetrical treatment of benefits and costs associated with a resource can lead to a biased assessment of the resource. To avoid such bias, benefits and costs should be treated symmetrically for any given type of impact. |
| Principle 4 | Account for Relevant, Material Impacts Cost-effectiveness tests should include all relevant (according to applicable policy goals), material impacts including those that are difficult to quantify or monetize. |
| Principle 5 | Conduct Forward-Looking, Long-term, Incremental Analyses Cost-effectiveness analyses should be forward-looking, long-term, and incremental to what would have occurred absent the DER. This helps ensure that the resource in question is properly compared with alternatives. |
| Principle 6 | Avoid Double-Counting Impacts Cost-effectiveness analyses present a risk of double-counting benefits and/or costs. All impacts should therefore be clearly defined and valued to avoid double-counting. |
| Principle 7 | Ensure Transparency Transparency helps to ensure engagement and trust in the BCA process and decisions. BCA practices should therefore be transparent, where all relevant assumptions, methodologies, and results are clearly documented and available for stakeholder review and input. |
| Principle 8 | Conduct BCAs Separately from Rate Impact Analyses Cost-effectiveness analyses answer fundamentally different questions than rate impact analyses, and therefore should be conducted separately from rate impact analyses. |
Importantly, applying the NSPM principles help to ensure that impacts are treated symmetrical to avoid over or under-counting a cost or benefit stream, the BCAs are forward-looking and do not account for sunk costs (i.e., lost revenues), and that impacts are not double counted. Transparency is important to ensure that regulators and all stakeholders understand the inputs and results of a BCA. Finally, the NSPM dedicates a full appendix to describing why BCAs and rate impact analyses (which are both important) should be conducted separately and not in combination (i.e., avoid the use of the RIM test). The use of the RIM test is further discussed below.
Understanding Methods of Cost-Benefit Analysis
Most states in the Southeast require utilities to employ the use of one or more traditional cost-effectiveness tests to analyze the costs and benefits of a proposed program. The states’ primary cost-effectiveness tests measure the net benefits or costs of proposed programs and are used to determine whether the states’ commission or regulatory body will approve of the proposed program or not. Secondary cost-effectiveness tests are sometimes used to inform program design further and prioritize efficiency program investments and strategies. Test definitions and up-to-date testing mechanisms for southeast states are housed in the Database of Screen Practices (DSP).
| State | Primary Test | Secondary Test |
| Alabama | None | None |
| Arkansas | TRC | UCT, PCT, RIM |
| Florida | RIM | TRC, PCT |
| Georgia | TRC | UCT, PCT, SCT, RIM |
| Kentucky | TRC | UCT, PCT, RIM |
| Louisiana | TRC | UCT, PCT, RIM |
| Mississippi | TRC, UCT, PCT, RIM | None |
| North Carolina | UCT, TRC | PCT, RIM |
| South Carolina | UCT, TRC | RIM |
| Tennessee | TRC | UCT, PCT, RIM |
| Virginia | TRC, UCT, PCT, RIM | None |
The Total Resource Cost Test (TRC), Utility Cost Test (UCT), Participant Cost Test (PCT), Rate Impact Measure (RIM), and Society Cost Test (SCT) are the primary and secondary tests currently used throughout the region. The TRC is the most common primary test used to measure cost-effectiveness of investments. Both the UCT and PCT are the most common secondary tests.
The Rate Impact Measure
Energy efficiency programs are voluntary for customers to participate in. Therefore, those customers who participate will receive program benefits while others who do not participate may not; however, all customers pay for these programs. Accordingly, public service commissions are rightly concerned with maintaining a balance between the benefits energy efficiency programs provide and the costs to non-participating customers. Many commissions rely on the Rate Impact Measure (RIM) test from the California Standard Practice Manual (CASPM) for this purpose. The logic is that any program that puts upward pressure on rates will negatively impact non-participating customers.
The NSPM makes the case that the RIM test is not appropriate as a BCA test and recommends instead that a more full-fledged rate bill impact analysis should be conducted to comprehensively measure the benefits of energy efficiency programs and costs to both participants and non-participants. Unlike other cost-effectiveness tests, the RIM test indicates whether DER investments will impact rates, while benefit-cost analysis reveals which DERs will provide benefits that outweigh the average customer cost. A comprehensive RIM analysis reveals how programs will affect ratepayers’ costs, how the installation of a DER will affect the overall price ratepayers pay towards their monthly electricity bill, and the percentage of ratepayers in a certain jurisdiction who will experience either bill reductions or bill increases. The NSPM discusses this in more detail in Appendix A.
Additional Resources
As more commissions and utilities consider adopting a JST designed for their unique circumstances, they may benefit from resources that supplement the NSPM, including NSPM case studies from states that have already gone through the process to the Methods, Tools, and Resources Handbook that provides technical guidance on how to monetize or quantify specific costs and benefits (utility and non-utility system impacts) to include in a JST.
Stakeholders also recognize that BCAs do not address equity issues – specifically, who benefits and who pays for DERs. The NESP, in coordination with Lawrence Berkeley National Laboratory, is creating guidance for commissions to conduct a “distributional equity analysis” (DEA) as a complementary analysis to BCA, providing a broader decision framework for DER investments. The DEA Guide is due to be published in fall 2023. For more information, please see https://emp.lbl.gov/publications/distributional-equity-analysis
Acknowledgments
Thank you to Julie Michals of E4theFuture for their expertise on the NSPM for DERs and contribution to the development of this resource. Read more about how to apply the NSPM for DERs.
Questions? Contact Lily Smith, program associate.
Map of the Month – February
Laura Diaz-Villaquiran
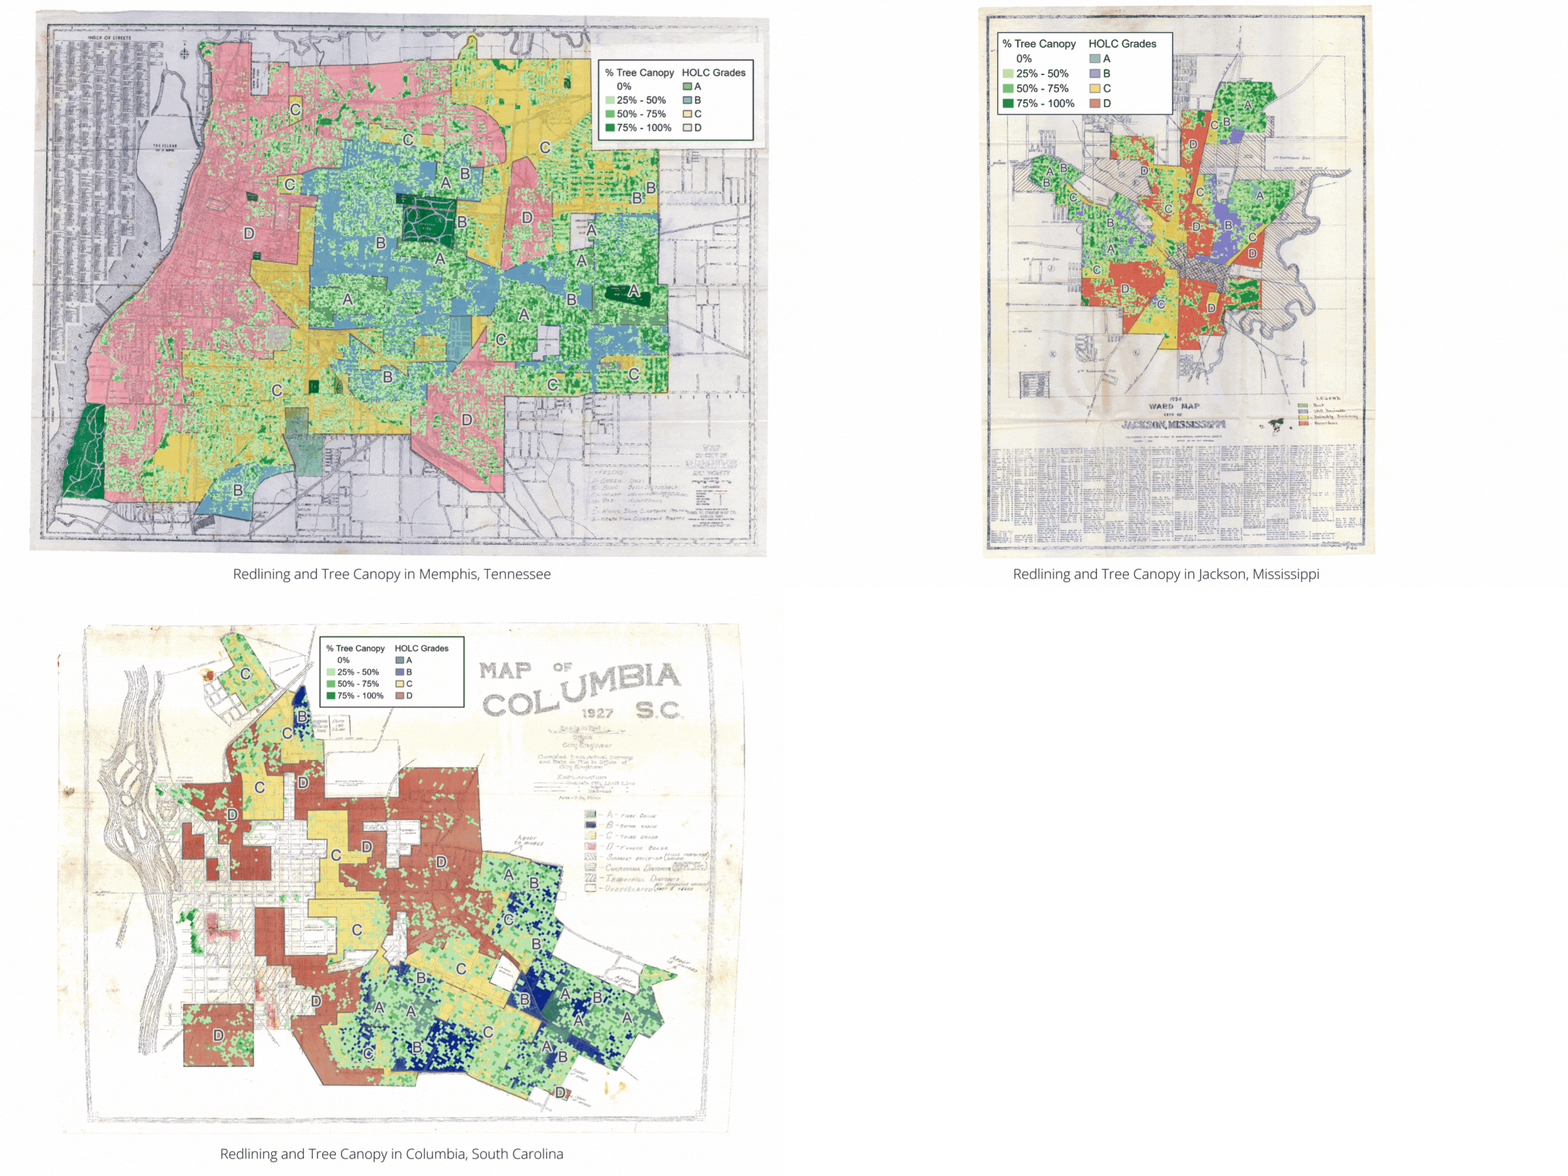
Hover over the map to click through the slideshow. Click on image to view full image.
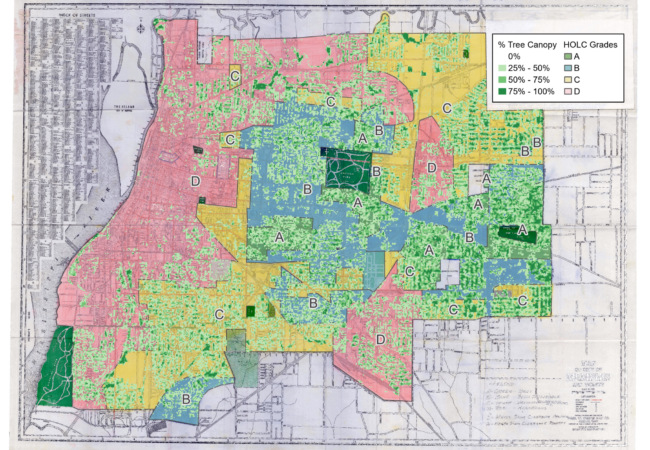
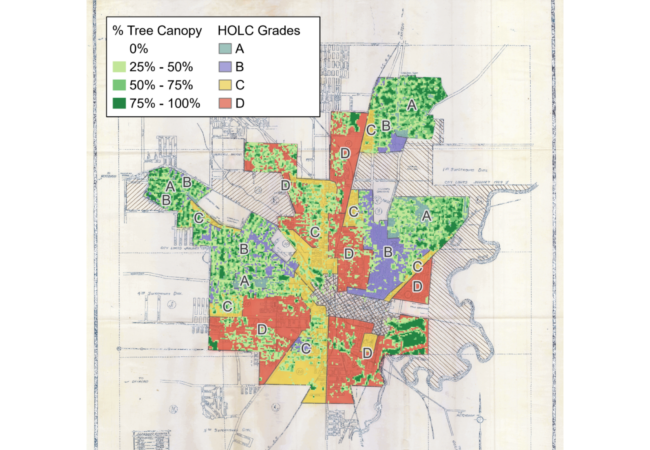
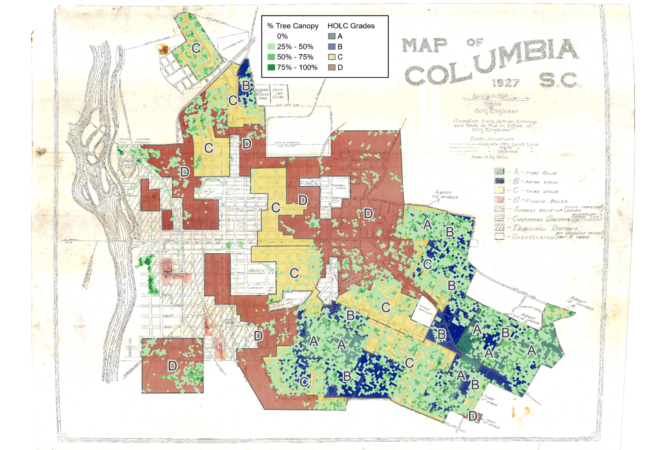
Data Source: Mapping Inequality: Redlining in New Deal America Dataset; U.S. Forest Service Tree Canopy Cover (TCC) Dataset; Maps: SEEA.
Few things have impacted cities today as much as the suite of policies and practices that segregated neighborhoods on the basis of race over more than a century. Housing segregation had existed in practice for decades before the 1910s when white policymakers enacted the first racial zoning laws. Although these laws were declared unconstitutional by the United States Supreme Court in 1917, white city officials throughout the South still found ways to advance racial residential segregation.
In the 1920s and 1930s, segregation was taken up by the federal government in the form of “redlining,” the practice of denying financial lending – particularly for home purchases or improvements – to people based on their race or ethnicity and what neighborhood they lived in. For instance, the federal Home Owners’ Loan Corporation (HOLC) developed a series of maps that used the racial makeup of city neighborhoods to guide mortgage lending practices based on their assessment of the risk of lending. HOLC devised a four-tiered system that characterized neighborhoods in more than two hundred cities as A – best, B – still desirable, C – declining, and D – hazardous. These ratings were largely based on the racial makeup of a neighborhood, with C and D ratings typically having a larger share of racial and ethnic minorities than neighborhoods that rated A and B.
HOLC maps had less of an impact on private markets than often suggested, but they guided Federal Housing Administration (FHA) lending decisions for decades. Beyond that, they are also a spatial reflection of generations of policies and programs that segregated American cities, with far-reaching consequences that still shape cities today.
Using tree canopy cover data from the U.S. Forest Service, this month’s map explores the relationship between redlining and urban tree canopy. In three cities (Columbia, Jackson, and Memphis), we find that formerly redlined neighborhoods have about half the level of tree canopy today than historically white neighborhoods.
In Memphis, Tennessee, formerly redlined neighborhoods have an average tree canopy covering 20% of the neighborhood, while neighborhoods rated “A” have canopies that cover about 43% of their land area. In Jackson, Mississippi, formerly redlined neighborhoods had an average tree canopy of 24%, while neighborhoods rated “A” have 50% canopy cover. In Columbia, South Carolina, formerly redlined neighborhoods had 15% tree canopy, compared to 32% for non-redlined neighborhoods.
These findings are consistent with national studies, which demonstrate how the legacies of residential segregation continue to impact people of color. This results in uneven access to public greenspace, less shade from trees, hotter temperatures, and poor air quality which can lead to more heat-related illness and asthma rates. Increased temperatures can place higher energy demands and financial burdens on people living in these areas, which will further strain health and household budgets as extreme heat becomes more common in the next few decades.
These implications underscore the need for comprehensive energy efficiency, clean energy, and urban planning strategies to mitigate adverse impacts. They also show that energy efficiency is an intersectional issue that must be advanced through collaborative efforts across sectors, including energy, public health, urban planning, and development.


