
Category: Utilities
NSPM 101: Evaluating Costs & Benefits of Energy Efficiency Investments from the Regulator’s Perspective

Lily Smith

Conducting Benefit-Cost Analysis for Energy Efficiency and Other DERs
How much energy efficiency should utilities deliver? This question is the subject of discussion among many stakeholders, including utilities, public service commissions, ratepayers, and others interested in maintaining a clean, reliable, affordable energy system. Undoubtedly, a variety of perspectives contribute to this answer – one of them is understanding the costs and benefits of energy efficiency programs. For decades, most utilities and commissions have relied on the California Standard Practice Manual – guidance established forty years ago – to evaluate the costs and benefits of energy efficiency programs from different stakeholder perspectives, including program participants, utilities, a ‘total resource’ perspective, and even society. However, up until recently, there has been no approach that evaluates energy efficiency investments from the energy regulator’s perspective – the entity making final decisions about energy efficiency programs, budgets, and related issues.
The National Standard Practice Manual (NSPM)
In 2017, the National Standard Practice Manual for Assessing Cost-Effectiveness of Energy Efficiency Resources (NSPM for EE) was published by the National Energy Screening Project. This manual provided a framework for cost-effectiveness testing with a focus on energy efficiency. In 2020, the National Standard Practice Manual for Assessing the Cost-Effectiveness of Distributed Energy Resources (NSPM for DERs, or NSPM) was developed (expanding on the NSPM for EE) to account for other DERs—demand response, distributed generation (e.g., rooftop solar, combined-heat power), distributed storage, electric vehicles and building electrification. The NSPM for DERs supplants the earlier EE version.
The NSPM for DERs is policy-neutral and employs the use of economically sound principles, concepts, and methodologies for both single and multi-DER analysis to help guide the development of jurisdictions’ cost-effectiveness test(s) for conducting benefit-cost analyses (BCAs) of DERs.
Unique to the NSPM is that it fills the gap by proposing a regulatory perspective to support the development of a jurisdiction’s primary cost-effectiveness test, which the NSPM refers to as a ‘Jurisdiction-Specific Test’ (JST). The NSPM provides eight foundational guiding principles and a multi-step process for developing a JST.
NSPM BCA Principles
The NSPM for DERs builds on traditional cost-effectiveness tests by focusing on the regulatory perspective, where a core principle is to ensure alignment with the jurisdiction’s applicable energy policies. Such an alignment may influence the inclusion (or exclusion) of certain impacts (benefits and costs) included in the test. As such, a state’s JST may (or may not) align with one of the traditional cost tests, as this will depend on the state’s specific policies. Further, the NSPM principles emphasize the importance of ensuring consistency across DERs and regulatory mechanisms for measuring cost-effectiveness to avoid bias in resource investment decisions. The NSPM can help states create a consistent BCA framework for valuing the full range of DERs. Policymakers are encouraged to design a BCA guided by the NSPM BCA Principles below.
Table 1. NSPM BCA Principles
| Principle 1 | Treat DERs as a Utility System Resource DERs are one of many energy resources that can be deployed to meet utility/power system needs. DERs should therefore be compared with other energy resources, including other DERs, using consistent methods and assumptions to avoid bias across resource investment decisions. |
| Principle 2 | Align with Policy Goals Jurisdictions invest in or support energy resources to meet a variety of goals and objectives. The primary cost-effectiveness test should therefore reflect this intent by accounting for the jurisdiction’s applicable policy goals and objectives. |
| Principle 3 | Ensure Symmetry Asymmetrical treatment of benefits and costs associated with a resource can lead to a biased assessment of the resource. To avoid such bias, benefits and costs should be treated symmetrically for any given type of impact. |
| Principle 4 | Account for Relevant, Material Impacts Cost-effectiveness tests should include all relevant (according to applicable policy goals), material impacts including those that are difficult to quantify or monetize. |
| Principle 5 | Conduct Forward-Looking, Long-term, Incremental Analyses Cost-effectiveness analyses should be forward-looking, long-term, and incremental to what would have occurred absent the DER. This helps ensure that the resource in question is properly compared with alternatives. |
| Principle 6 | Avoid Double-Counting Impacts Cost-effectiveness analyses present a risk of double-counting benefits and/or costs. All impacts should therefore be clearly defined and valued to avoid double-counting. |
| Principle 7 | Ensure Transparency Transparency helps to ensure engagement and trust in the BCA process and decisions. BCA practices should therefore be transparent, where all relevant assumptions, methodologies, and results are clearly documented and available for stakeholder review and input. |
| Principle 8 | Conduct BCAs Separately from Rate Impact Analyses Cost-effectiveness analyses answer fundamentally different questions than rate impact analyses, and therefore should be conducted separately from rate impact analyses. |
Importantly, applying the NSPM principles help to ensure that impacts are treated symmetrical to avoid over or under-counting a cost or benefit stream, the BCAs are forward-looking and do not account for sunk costs (i.e., lost revenues), and that impacts are not double counted. Transparency is important to ensure that regulators and all stakeholders understand the inputs and results of a BCA. Finally, the NSPM dedicates a full appendix to describing why BCAs and rate impact analyses (which are both important) should be conducted separately and not in combination (i.e., avoid the use of the RIM test). The use of the RIM test is further discussed below.
Understanding Methods of Cost-Benefit Analysis
Most states in the Southeast require utilities to employ the use of one or more traditional cost-effectiveness tests to analyze the costs and benefits of a proposed program. The states’ primary cost-effectiveness tests measure the net benefits or costs of proposed programs and are used to determine whether the states’ commission or regulatory body will approve of the proposed program or not. Secondary cost-effectiveness tests are sometimes used to inform program design further and prioritize efficiency program investments and strategies. Test definitions and up-to-date testing mechanisms for southeast states are housed in the Database of Screen Practices (DSP).
| State | Primary Test | Secondary Test |
| Alabama | None | None |
| Arkansas | TRC | UCT, PCT, RIM |
| Florida | RIM | TRC, PCT |
| Georgia | TRC | UCT, PCT, SCT, RIM |
| Kentucky | TRC | UCT, PCT, RIM |
| Louisiana | TRC | UCT, PCT, RIM |
| Mississippi | TRC, UCT, PCT, RIM | None |
| North Carolina | UCT, TRC | PCT, RIM |
| South Carolina | UCT, TRC | RIM |
| Tennessee | TRC | UCT, PCT, RIM |
| Virginia | TRC, UCT, PCT, RIM | None |
The Total Resource Cost Test (TRC), Utility Cost Test (UCT), Participant Cost Test (PCT), Rate Impact Measure (RIM), and Society Cost Test (SCT) are the primary and secondary tests currently used throughout the region. The TRC is the most common primary test used to measure cost-effectiveness of investments. Both the UCT and PCT are the most common secondary tests.
The Rate Impact Measure
Energy efficiency programs are voluntary for customers to participate in. Therefore, those customers who participate will receive program benefits while others who do not participate may not; however, all customers pay for these programs. Accordingly, public service commissions are rightly concerned with maintaining a balance between the benefits energy efficiency programs provide and the costs to non-participating customers. Many commissions rely on the Rate Impact Measure (RIM) test from the California Standard Practice Manual (CASPM) for this purpose. The logic is that any program that puts upward pressure on rates will negatively impact non-participating customers.
The NSPM makes the case that the RIM test is not appropriate as a BCA test and recommends instead that a more full-fledged rate bill impact analysis should be conducted to comprehensively measure the benefits of energy efficiency programs and costs to both participants and non-participants. Unlike other cost-effectiveness tests, the RIM test indicates whether DER investments will impact rates, while benefit-cost analysis reveals which DERs will provide benefits that outweigh the average customer cost. A comprehensive RIM analysis reveals how programs will affect ratepayers’ costs, how the installation of a DER will affect the overall price ratepayers pay towards their monthly electricity bill, and the percentage of ratepayers in a certain jurisdiction who will experience either bill reductions or bill increases. The NSPM discusses this in more detail in Appendix A.
Additional Resources
As more commissions and utilities consider adopting a JST designed for their unique circumstances, they may benefit from resources that supplement the NSPM, including NSPM case studies from states that have already gone through the process to the Methods, Tools, and Resources Handbook that provides technical guidance on how to monetize or quantify specific costs and benefits (utility and non-utility system impacts) to include in a JST.
Stakeholders also recognize that BCAs do not address equity issues – specifically, who benefits and who pays for DERs. The NESP, in coordination with Lawrence Berkeley National Laboratory, is creating guidance for commissions to conduct a “distributional equity analysis” (DEA) as a complementary analysis to BCA, providing a broader decision framework for DER investments. The DEA Guide is due to be published in fall 2023. For more information, please see https://emp.lbl.gov/publications/distributional-equity-analysis
Acknowledgments
Thank you to Julie Michals of E4theFuture for their expertise on the NSPM for DERs and contribution to the development of this resource. Read more about how to apply the NSPM for DERs.
Questions? Contact Lily Smith, program associate.
Map of the Month – February

William D. Bryan, Ph.D. & Joy Ward

Map: Southeast Energy Efficiency Alliance.
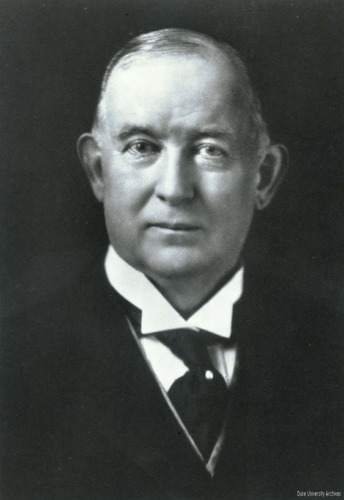
In honor of Black History Month, our February map pays homage to David Crosthwait, a Black engineer and inventor who designed heating, ventilation and air conditioning systems. One of his greatest contributions was developing heating systems for Rockefeller Center and Radio City Music Hall in New York. Today he is remembered for holding 39 patents that addressed a range of heating and ventilation problems. In 1971, he became the first Black person named a fellow of the American Society of Heating, Refrigeration, and Air Conditioning Engineers.
This month’s map visualizes the type of heating fuel households use at the county level across the United States for occupied housing units. It was created using data from the American Community Survey conducted by the U.S. Census Bureau.
Nationwide, most people rely on utility gas or electricity to heat their homes. Forty-seven percent of households use utility gas to fuel their heating equipment, while 39% use electricity. The remaining fuel types, bottled tank and fuel oil, are common in the Midwest and Northeast, respectively. In the South, electricity is most common with 68% of households using it as a source of heat, while just a quarter use utility gas.
One reason why the South has a high percentage of electricity use is because our region has a lower heating load and electric utilities have led successful heat pump installation programs. Despite this, urban centers such as Atlanta, Birmingham, Little Rock, Louisville, and Memphis predominately use utility gas. While this map suggests that the South is heavily electric, there are still millions of households in the Southeast that are eligible for the electric appliance tax credits and rebates available through the Inflation Reduction Act. These incentives can reduce the cost of energy efficient appliances like electric heat pumps, which are well-suited to the needs of Southern homes and dramatically reduce household energy consumption.
On March 15 at 2 p.m., hear from regional experts about how we can leverage federal funding to help low-income renters access energy efficient technology for their homes. Register for How to Make Clean Energy Upgrades More Accessible to Renters today.
COVID-19 Resources: Delivering customer support in a new world

Since our last post, new unemployment numbers for the energy efficiency sector have not been released. The most recent unemployment and disconnection information can be found in our previous post. We continue to monitor those reports and will update this series with new information as we receive it.
In the eighteen months since we first learned about COVID-19, we have realized that our lives would not be returning to normal as quickly as we had hoped, and there could be some new aspects of daily life that remain long after the coronavirus subsides. Many of us are still working at home, schools weigh continuing precautions, and while improved, unemployment remains high. We have been listening to how our industry and our members’ work has changed since spring 2020 and how it continues to adapt while we learn to live through a pandemic.
When service providers could not enter homes and provide services like home energy assessments and weatherization upgrades, organizations looked for other ways to keep the workforce engaged and provide uninterrupted services to customers. The pandemic also exposed the fault lines in the systems that deliver energy to our homes, schools, and businesses. Our community discovered an opportunity to ensure that all people could live and work in comfortable buildings, expand electric mobility, and create more prosperity across the Southeast.
In October 2020, we surveyed our utility partners and found that many energy efficiency programs had fully resumed, with adaptations or brand new programs to reach home-bound customers. In June, at the National Energy & Utility Affordability Coalition (NEUAC) annual conference, director of energy efficiency policy, Cyrus Bhedwar spoke on how to include more equity in program design, and we learned how program delivery is changing to reach more people at home. Some of the ways utilities are innovating around service barriers include:
- Phone-based walk-throughs with customers
- App-based surveys
- Virtual training for contractors
- Online applications and e-signatures
- Extended crisis benefits to customers affected by COVID
Technicians, service providers, and utilities have found these adaptations not only maintained business during a pandemic, but also improved many facets of program implementation like scheduling, cost, customer engagement, and delivery time. However, innovation does not come without some hurdles. Poor cell phone reception, battery life, and customer access to technology are common challenges. Implementers encountered issues such as trying to explain how technical instruments worked to nontechnical customers. Despite these concerns, companies are keeping many of the innovative approaches to providing remote or virtual energy efficiency services.
As the region, nation, and world grapples with how to tackle the coronavirus, the energy efficiency sector continues to take steps to improve the health, comfort, and resilience of our communities. We continue to seek out and monitor the ways in which our industry continues to adapt to a new way of working and living in a pandemic.
Additional Resources:
Energy Efficiency Jobs in America
E4TheFuture
Sustainable Energy in America 2021 Factbook
BCSE
Pursuing more equity in energy efficiency programs in the Southeast

SEEA’s approach to realizing a more efficient Southeast has grown in depth and reach in the eight years I’ve been with the organization. Our work increasingly spans a broad range of topics that are tied together by the aspiration for all people in the Southeast live and work in healthy and resilient buildings, utilize clean and affordable transportation, and thrive in a robust and equitable economy.
In May, we wrote about the game-changing potential of the American Jobs Plan. In addition to recasting the way we think about community, the plan includes a strong focus on providing opportunity for all Americans and to make amends for historic inequities built into the infrastructure of our country.
Last week, I had the pleasure of sharing how SEEA is thinking about its own contributions to a more equitable Southeast at the NEUAC 2021 Annual Conference. Our journey started at the tail end of our role in administering $25 million in funding from the American Recovery and Reinvestment Act in 2013 but I’m going to fast forward to last year.
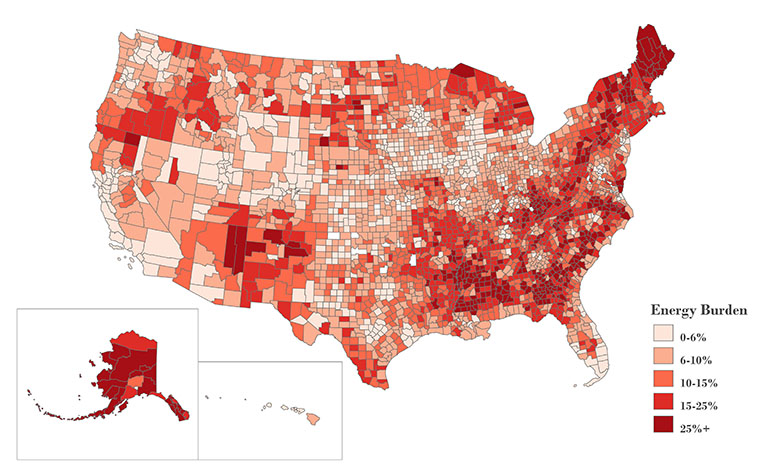
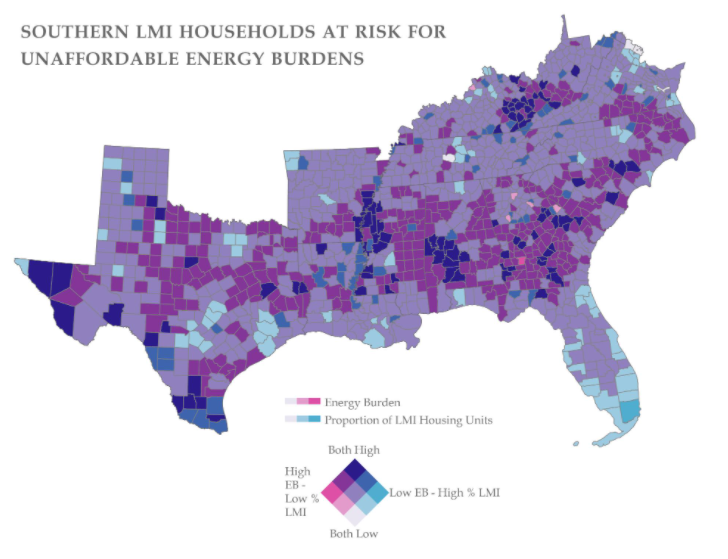
Like many organizations, SEEA felt an urgency to accelerate and deepen its work on racial justice and energy equity issues in the summer of 2020. In partnership with TEPRI, SEEA published Energy Insecurity in the South which illustrates the deeply rooted connection between historic racial and economic inequities and the region’s current struggle with energy burden, and Energy Insecurity Fundamentals for the Southeast, which further defines the multiple dimensions of energy insecurity, including energy burden.
Energy insecurity is pervasive, particularly in the Southeast. More than a third of the region’s population has trouble paying their energy bills. The Southeast has the lowest electric rates in the contiguous United States, but the highest residential bills.
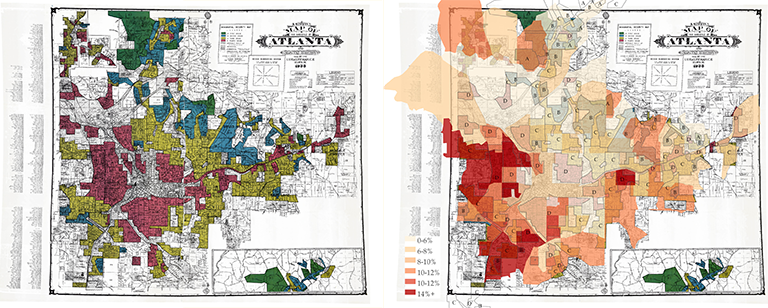
Housing segregation, or redlining, which led to disinvestment in communities of color, still shapes access to affordable energy in the South. Neighborhoods that were historically segregated often experience high levels of energy burden today.
So how does this relate to energy efficiency? At SEEA, we’re exploring how energy efficiency can relieve energy insecurity and provide other benefits such as improved health outcomes through better indoor environmental quality. The next step is to determine how to get energy efficiency to those who need it most.
I have sat in hundreds of hours of meetings collaborating with utilities and regulators to develop energy efficiency programs that serve the utility’s customers. In that time, I have witnessed utilities and regulators express more interest in improving energy efficiency programs for low-income customers and growth in program size and sophistication.
Through our work, we have learned that focusing on “low-income” is often a proxy for addressing equity. As SEEA confronted the reality of racial injustice, we learned about the history as well as the breadth and variety of challenges experienced by communities that have faced systemic discrimination. In Atlanta, the median energy cost burden is 32% higher for Black households and 52% higher for Hispanic households compared to white households.
Simultaneously, we learned about how to think about equity. Our understanding will continue to evolve, but for now we use the following dimensions of equity:
Procedural equity, or that all affected communities have a voice in the decision-making process;
Distributional equity, or that programs are designed to equally distribute its benefits and burdens to the entire community; and
Intergenerational equity, or programs that consider how future generations will be impacted by the decisions being made today.
We then began to think about where equity starts in the energy efficiency program development process. We focused on regulated investor-owned utilities (IOUs) because of their more mature and consistent approach. Program development begins with evaluating energy efficiency potential and setting a spending or savings target. After analysis and design, the programs are deployed, evaluated, and the cycle repeats. Many utilities periodically conduct energy efficiency potential studies to determine how much cost-effective energy efficiency is available in their service territory and for which customer classes.
In the first stage of energy efficiency program development, analyzing factors including, but not limited to, customer segmentation, housing type, language spoken in the home, and ethnicity shed light on the program’s equity. This analysis evaluates how different customers perceive and participate in energy efficiency programs, or its distributional equity. For example, rebate-based programs often exclude customers who either cannot afford upgrades or are renters who do not have control over upgrades to their homes.
We can address distributional equity through procedural equity. If representatives from the communities being served have the opportunity for their voices to be heard during program development, the program has a higher chance of reaching more customers in those communities. Finally, as the Energy Insecurity in the South StoryMap illustrates, are decision makers accounting for structural and transgenerational inequities?
During a virtual SEEA member meeting we held last year to discuss long-term innovations in energy efficiency programs, we heard emphatically that, “energy efficiency needs more teachers!” Meaning, when programs and the people that deliver those programs don’t listen to the experiences and circumstances of the people they serve, those programs will reach fewer customers. When programs are delivered by contractors who are trained to listen to the needs of the customer, establish trust, and guide them through the process, programs are much more sustainable and successful.
Lastly, what indicators do we use to measure success, and how does equity factor into that evaluation? SEEA is currently developing a data collection and stakeholder engagement plan that will shape a guide to help decision makers at commissions and utilities consider equity throughout the energy efficiency program development process and develop approaches that meet their particular needs.
Energy efficiency is an evolving set of solutions that expands alongside our individual and organizational capacity for empathy. The Southeast has the greatest opportunity for growth in energy efficiency and an opportunity to ensure that prosperity reaches everyone.
We’ll continue to keep our members informed as we make progress in this area, in the meantime, please contact Cyrus Bhedwar, director of energy efficiency policy, with any questions or feedback.
COVID-19 Resources

Our new COVID-19 Resources allows for more relevant and more frequent updates. You can access the original, archived resource page at any time.
We welcome your feedback and suggestions. Contact us anytime at covid19@seealliance.org.

Highlights
- The U.S. lost over 429,000 clean energy jobs from March to December, finishing 2020 with the fewest number of workers in the industry since 2015 It also marked the first year clean energy saw a decline in jobs over the previous year.
- Nationally, job losses in the clean energy and energy efficiency sectors increased 12% since the pre-pandemic era.
- 16,900 jobs were added nationally in December.
- Clean vehicles experienced ongoing job loss of 31,468 and recovered about 400 jobs.
- “Black and Hispanic workers continue to suffer from disproportionately high levels of unemployment overall, and Hispanic workers suffered increased unemployment rates in December. Women – particularly women of color – lost jobs in December overall while men gained jobs.”
- In December, the states with the largest gains, Texas, New York, North Carolina, and Florida secured more than 800 clean energy jobs
- “Over 40 states continue to suffer double digit job losses in clean energy with four states facing 20 percent or greater unemployment and one state, Georgia, facing 30 percent unemployment in the sector.”
- “The counties that suffered hardest as a percent of their workforce are Fulton County, GA; DeKalb County, GA; and Kern County, CA.”
Workforce Losses by Month (March – December 2020)


Workforce Losses by State (March – December 2020)


Related News
- EIA estimates in its Annual Energy Outlook 2021, that it will take 10 years for energy consumption from all energy sources to return to pre-pandemic levels.
- Bloomberg New Energy Finance and the Business Council for Sustainable Energy reports in the annual Sustainable Energy in America Factbook that although energy use dropped 3.8% overall, residential electricity use increased.

Highlights
- All eleven of the states in SEEA’s territory have resumed utility disconnections. Some commissions have restored winter disconnection moratoria to alleviate mounting customer arrearages.
- Customer arrearages or energy debt adds to a household’s energy insecurity. Energy insecurity is a key metric for understanding the inequitable distribution of the benefits and burdens of the energy sector to residents of the Southeast. Learn more about energy insecurity in our recent blog post, report, and storymap.
- NARUC has a new tracker following state responses to utility disconnections.
- NEADA tracks dates for COVID19 disconnection moratoria along side annual winter disconnection moratoria.
Related News
Powering the South with “White Coal”
This is the first in a series of blog posts about the history of energy in the Southeast.
In October of 1867 naturalist John Muir was in the middle of a thousand-mile walk through the South when he met a cotton planter, Mr. Cameron, on his farm outside of Augusta, Georgia. Reclining by the fireplace after dinner, Cameron told Muir, “Young man…I see that your hobby is botany. My hobby is e-lec-tricity.” He predicted that “the time is coming, though we may not live to see it, when that mysterious power or force, used now only for telegraphy, will eventually supply the power for running railroad trains and steamships, for lighting, and, in a word, electricity will do all the work of the world.”
Within three decades, Cameron’s vision had come true. Beginning at the fall line – just miles from his cotton farm – companies harnessed rivers to generate electricity, building dams and stringing transmission lines throughout the South that supplied power for streetcars, factory machinery, lighting, and more. Generating electricity became big business, and the South’s booming energy sector soon outpaced the rest of the nation.
This was nothing short of a revolution – one that would forever change the modern South – and it was founded on the need for a cheap, clean, and renewable source of energy.

When Muir traveled through the South in 1867, “power” meant one thing: running water. Still more than a decade before electricity was first used in cities, machinery was directly powered by steam or water. The agricultural South had few profitable industries, but in the years after the Civil War Southerners boasted that the region’s humid climate and abundant waterpower would be the foundation for rebuilding their economy in the image of the urban, industrial North.
Running water was deemed “white coal” – a source of power that was renewable, did not require costly transportation by rail, and could not be disrupted by unionization efforts or labor struggles in the mines. Waterpower was also clean and did not pollute cities with dark clouds of smoke. As one North Carolinian explained, “There will be no coal to go in, no ashes to go out, no gas, no soot, no dirt.” Because water could be stored behind dams until there was a demand for energy, industry leaders considered hydroelectric power the most efficient use of their waterways. Letting rivers run wild was a waste of the region’s abundant resources, at least in the eyes of the South’s business and political elite.
Nikola Tesla and George Westinghouse inaugurated what Tesla called the “Age of Electricity” in 1896 when they completed a powerhouse that generated electricity from Niagara Falls and supplied it to Buffalo, New York. After the promise of city scale hydroelectric power was demonstrated at Niagara Falls, Southerners turned to their running waters to generate electricity. By the 1890s, private efforts to harness the region’s white coal were in full swing.
Tobacco magnate James Buchannan Duke was the industry pioneer in the region. During an examination with physician Walker Gill Wylie – an investor in South Carolina’s Catawba Power Company – Duke was convinced of the hydroelectric potential of the Southeast. With the backing of Wylie, in 1905 Duke purchased all of Catawba Power’s assets and made them the foundation for his newly organized Southern Power Company. Duke explained that his company was intended to prevent the “waste to the sea” from free-flowing rivers by putting the region’s “white coal” to work generating electricity. Within six years Duke controlled a network of four hydroelectric dams and two coal-powered steam plants. The company’s 1,400 miles of transmission lines supplied power to more than 150 textile mills throughout the Carolinas and to Duke’s own electric railway that ferried passengers between Charlotte and Gastonia.
Duke’s work to build a network of dams across multiple watersheds stitched together by long-distance transmission lines was repeated by other companies throughout the region, especially in Alabama, Georgia, and the Carolinas where waterpower potential was highest. Between 1920 and 1930, the South’s electric industry grew by at least 9% each year – well ahead of the rest of the nation – and between 1926 and 1929 half of all the hydroelectric capacity added in the nation came from the South. On the eve of the Great Depression, the South accounted for more than a quarter of the nation’s hydroelectric generating capacity, and one researcher reported that the South “is now, and will continue to be, entirely self-sufficient as to power.”
The power sector was dominated by just a few utilities. After waves of corporate consolidation, by the 1920s 84% of the region’s power was controlled by only seven companies. These utilities worked together to create an interconnected regional network of transmission lines that allowed hydroelectric power to be transmitted to consumers across 3,000 miles of transmission lines covering five states and more than 120,000 square miles. No other part of the country had a grid this advanced, and the region’s “Superpower System,” according to an expert at the time, was “a more complete integration of power-producing and transmission capacity than exists anywhere else in the world.” Where mills had once been tied to the water’s edge, the South’s new electric grid transported power to communities far from the site of generation.

The expansion of electric generation and transmission was not a smooth process, however. Many Southerners were angry when the free-flowing rivers they relied on for food, transportation, and recreation were dammed to turn turbines. Others called out the near-monopolistic control that just a few utilities had over the South’s electric power. By the 1920, 45 states had established regulatory bodies to oversee utilities, especially their power to set rates.
The biggest issue, however, was that the benefits of the cheap electricity flowed unevenly. Utilities provided cities with electricity to power new incandescent lights and streetcars, and by the 1930s most city-dwellers had access to electric power. Businesses also benefitted, and the South’s manufacturing economy boomed as industries migrated to the region looking for cheap power. However, rural areas were cut out of this progress. Even as late as 1932 only 10% of people who lived in the country had access to electricity, widening the cultural and economic gap between city and country.
It took an economic disaster for the South’s rural voices to be heard for the first time. Our next installment in this series will explore how efforts to rebuild the nation’s economy after the Great Depression led the federal government to transform both the regulatory landscape and cultural meaning of electricity in the South in ways that endure today.
Explore More
- Christopher J. Manganiello, Southern Water, Southern Power: How the Politics of Cheap Energy and Water Scarcity Shaped a Region (University of North Carolina Press, 2017)
- Casey P. Cater, Regenerating Dixie: Electric Energy and the Modern South (University of Pittsburgh Press, 2019)
- Casey P. Cater, “Electrifying Race Relations: Atlanta’s Streetcars and the 1906 Riots,” Atlanta Studies, May 14, 2019
- William D. Bryan, The Price of Permanence: Nature and Business in the New South (University of Georgia Press, 2019)