February Map of the Month
By Amy Lovell

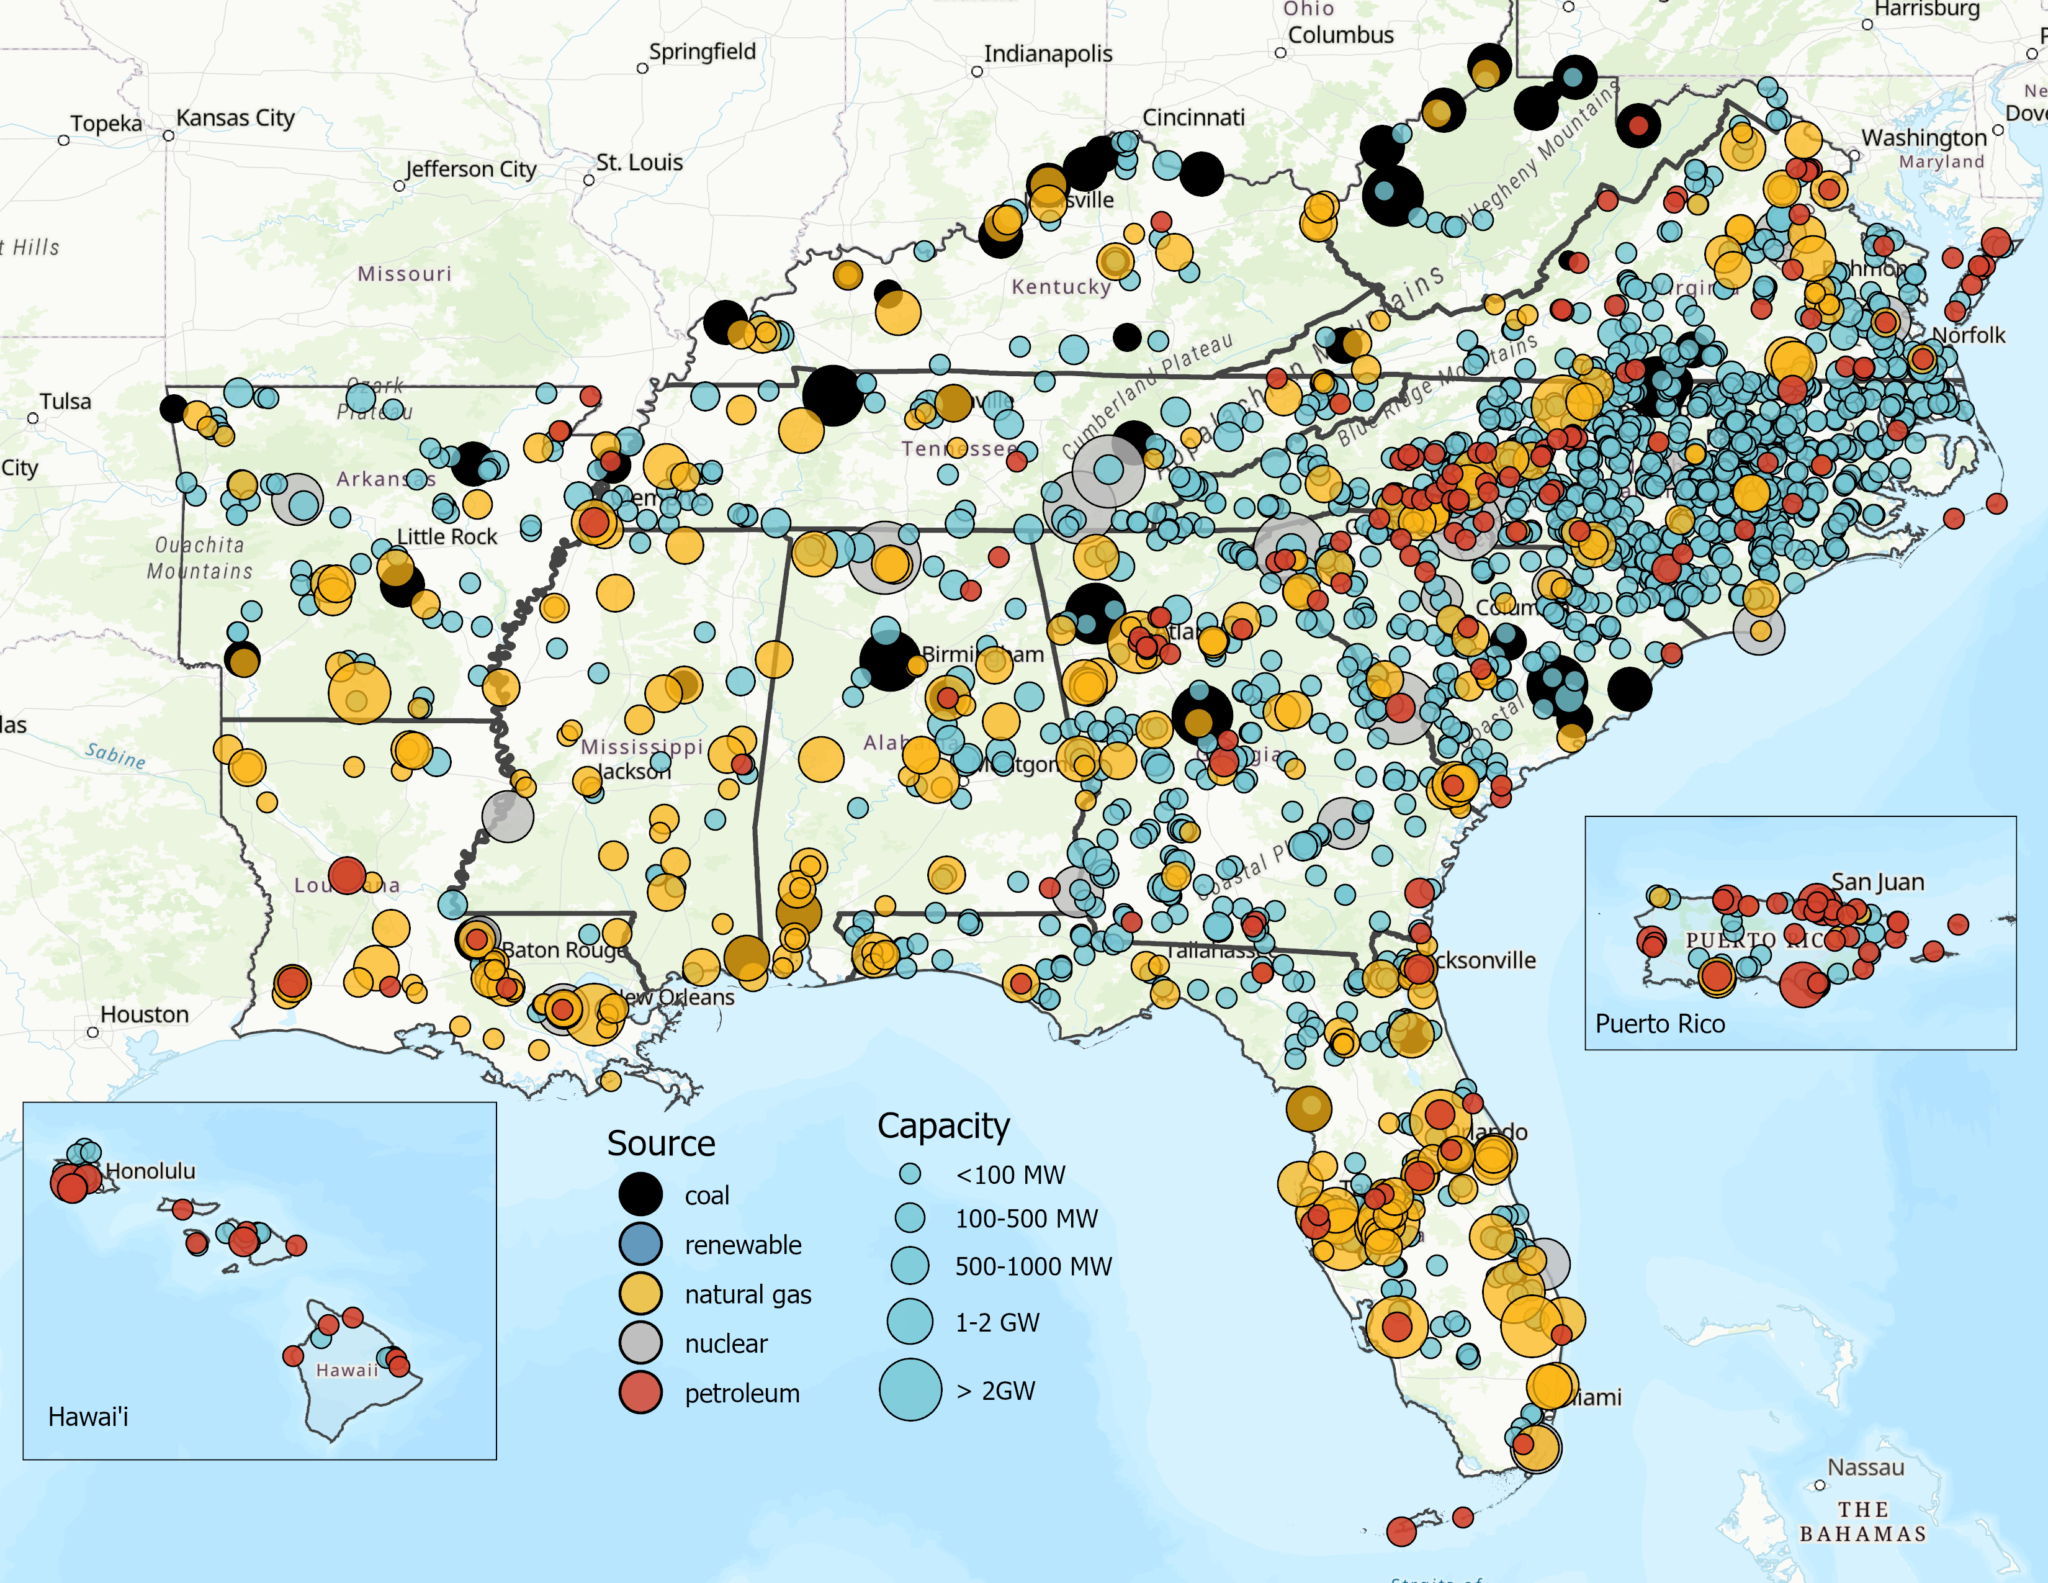
Map: Southeast Energy Efficiency Alliance (SEEA) Source: U.S. Energy Information Administration (EIA)
After decades of steady demand, power consumption is increasing at unprecedented rates across the United States. According to one recent study, there will be 128 GW of new power demand – around 30% of the 2024 electric capacity – added to the grid just in the next five years, largely fueled by the outsized energy needs of data center and computing facilities. A 2024 report from McKinsey lists Georgia and Florida as “emerging demand,” in addition to lower but fast-growing demand in five other Southeastern States where companies have been rapidly siting new computing and manufacturing facilities.
This month’s map considers the implications of this unprecedented load growth in the South. We use data from the U.S. Energy Information Administration (EIA) to review how Southern utilities currently generate power, as well as the expected energy and financial implications of new generation infrastructure that will be required to meet these needs.
The Southeast has a power generation capacity of 370 Gigawatts (GW), which is generated by a diverse portfolio of power plant types as shown in the chart below. Natural gas is the leading fuel source. It supplies around half of the region’s electric generating capacity, and is the main fuel in Florida, Louisiana, and Mississippi. Coal-fired power plants supply 16% of the region’s electricity, dominating power generation in Kentucky (68%) and West Virginia (74%). Nuclear power is a consistent energy source in all areas except the islands, Kentucky, and West Virginia, providing 11% of the region’s electricity. Nuclear power supplies more than one-third of electric power in Alabama, Georgia, and the Carolinas. Averaged over the region, oil comprises 2% of the power supply. Hydroelectric and pumped storage facilities throughout the region contribute 7%, with other renewable energy sources – including utility-scale solar – supplying the balance (11%).
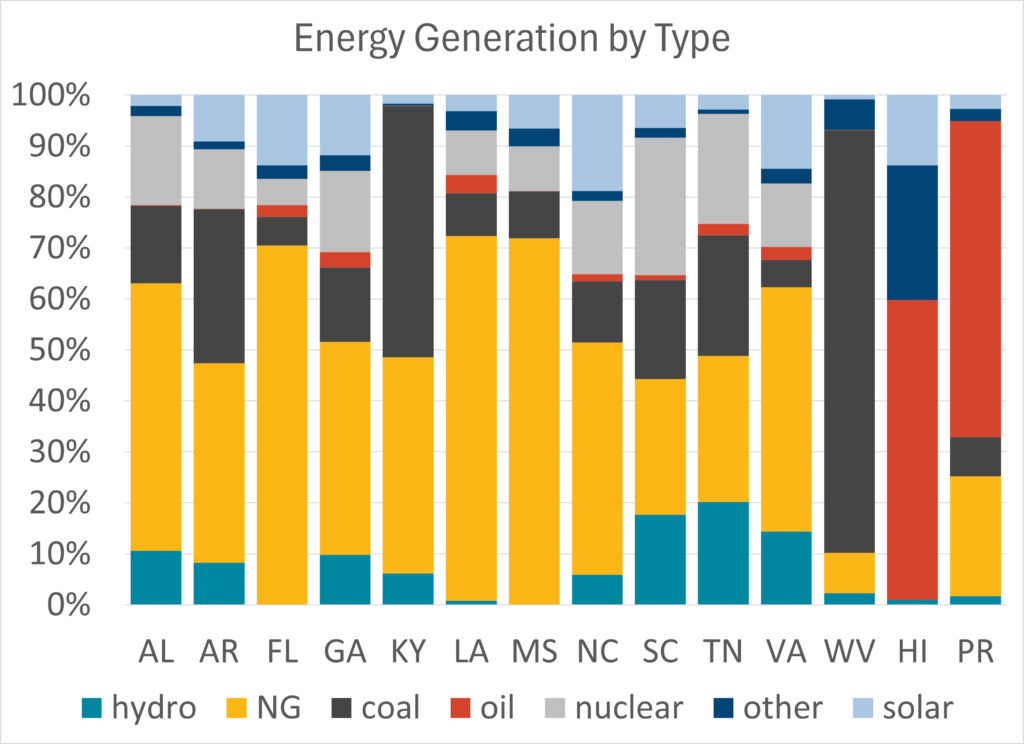
Profile of the energy generation capacity by type for the Southeast region, as well as the tropical islands of Hawai’i and Puerto Rico. The region draws a large portion of its energy capacity from natural gas-fired (NG) power plants, with the other half well diversified across other fuels. The “other” category includes batteries, biofuels, geothermal, or wind, which is not a significant contribution to power generation in the region.
The U.S. islands have a different energy mix given their climatic and geographic constraints. Petroleum-fired power plants dominate the energy supplied in the islands of Hawai’i and Puerto Rico, in addition to supplying small amounts of electric power in five other states. While the islands are largely reliant on petroleum oil-fired power plants, Hawai’i has committed to fully renewable electricity generation by 2045 and Puerto Rico has committed to a fully renewable portfolio by 2050 (en español), after a study in partnership with the Department of Energy.
Between 2018 and 2024, the Southeast added 21 GW of net new capacity (6%). New utility-scale solar facilities contributed the most capacity, with 25 GW (a 340% increase from 2018), with natural gas facilities adding an additional 19 GW (11%). Wind power capacity is small compared to other regions, with 400 MW (32% increase from 2018). After the decommissioning of some coal power plants, the capacity of coal-fired generation has decreased by 25 GW (28%), almost entirely offset by the additional solar generation capacity.
Expected power increases in the Southeast may strain available generation resources. With nationwide power demand predicted to increase 2% in both 2025 and 2026, the Southeast portion of the increase will require more than 15 GW of additional capacity by the end of 2026. If this were to be generated entirely from utility-scale solar power at 2022 prices ($1,588/kW), it would cost $24 billion to construct. From entirely natural gas ($820/kW), the cost would be $12.5 billion, along with an additional $2.4 billion annually for the fuel at $18/MWh.
In this map, each dot represents a different type of power generation facility in the Southeast, Hawai’i and Puerto Rico, with its full capacity indicated by the size of the circle. Nuclear power comes from 40 high-capacity generation units across the region, renewable (hydroelectric and solar shown in blue) generation comes from 2,400 smaller-capacity facilities, and natural gas provides the dominant share of regional electricity. Utility-scale electricity generation is not evenly spread across the region: facilities must be connected to the power grid to dispense to customers, and transmission lines must expand to incorporate new capacity to meet increasing demand.
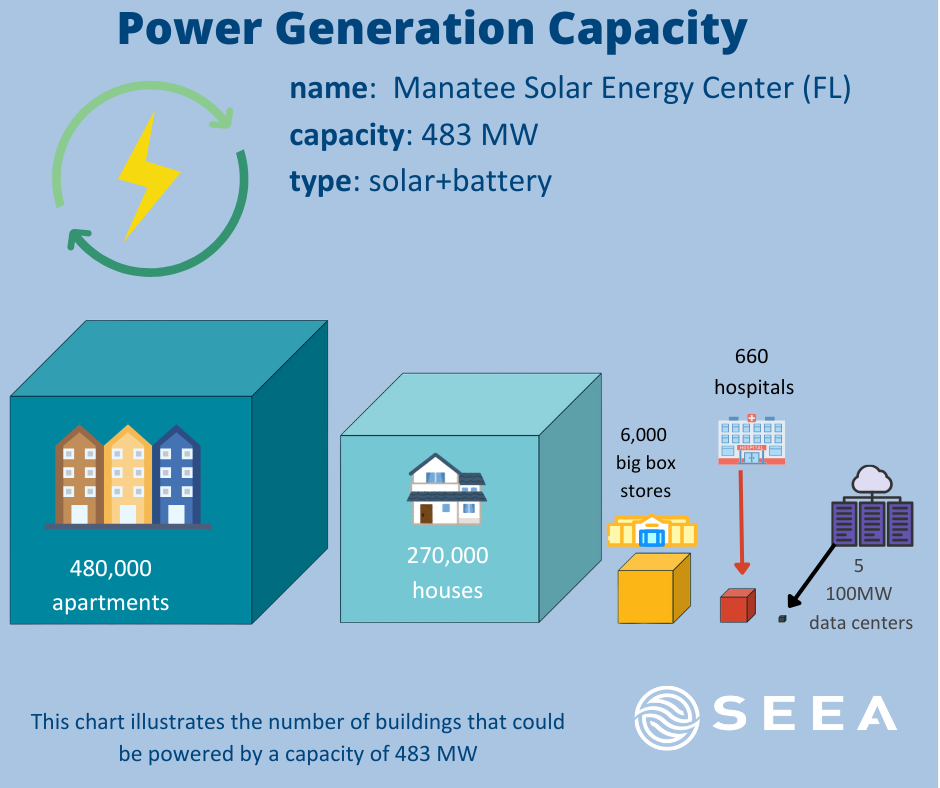
As power demand increases, we anticipate that the region will continue to rely on a diversified portfolio of sources to meet its power needs. Each new power plant built will contribute to meeting new demand: illustrated below are approximate numbers of buildings that could be powered by a single large solar facility if it were devoted entirely to a single type of building stock.
But we should not meet this need simply by building more generation facilities. Energy efficiency must be a critical component of the region’s diverse power mix. Continued efforts to expand energy efficiency in commercial, industrial, and residential sectors and added demand flexibility can reduce existing demand and work in tandem with other efforts to meet growing power demands. As the Southeast works to make sure the power supply remains reliable in the face of historic increases in power consumption, energy efficiency must be a critical tool to save energy, reduce demand, and lower costs for residential and business customers.