
Category: Built Environment
Southeast Energy Efficiency Alliance (SEEA) Launches BRESE Collaborative to Enhance Regional Building Codes
Atlanta, GA — 9/17/2024 — The Southeast Energy Efficiency Alliance (SEEA) is proud to announce the launch of the Building a Resilient and Efficient Southeast (BRESE) Collaborative, a groundbreaking initiative designed to address the region’s unique climate challenges and regulatory landscape. This collaborative effort aims to bolster energy code adoption, implementation, and compliance across the Southeast, a region currently lagging in building code advancements compared to national standards.
With energy emissions and building resilience increasingly at the forefront of regional concerns, the BRESE Collaborative will bring together a diverse group of stakeholders to enhance and streamline building energy codes. By focusing on tailored solutions for the Southeast’s climate zones and regulatory environments, the BRESE Collaborative will empower states and municipalities to effectively lower building emissions and improve energy efficiency.
The BRESE Collaborative will employ a multifaceted approach to drive progress, including the formation of peer-to-peer cohorts, a Community Code Innovation Prize for financial and technical support, and the provision of targeted technical assistance. The initiative will also create vital opportunities for convening and collaboration, directly engaging with state and local governments, implementers, and regional interest groups.
Maggie Kelley Riggins, senior program manager at SEEA, will lead this initiative as the principal investigator. “The BRESE Collaborative is a critical step towards advancing energy efficiency and resilience in the Southeast,” said Kelley Riggins. “By leveraging regional expertise and resources, we aim to create a sustainable model that not only addresses immediate challenges but also lays the groundwork for long-term improvements in building energy codes.”
Key partners in the BRESE Collaborative include the Georgia Environmental Finance Authority, the Virginia Department of Housing and Community Development, the Mississippi Energy and Natural Resources Division, Greenlink Analytics, and the Southeast Sustainability Directors Network. Together, these organizations will engage over 200 stakeholders across the region, delivering technical assistance to at least 25 cohorts and CCIP projects.
“Building codes in the Southeast lag behind the nations in energy efficiency improvements, impeding climate action,” said Matt Cox, CEO of Greenlink Analytics. “Improved codes reduce electricity use, decrease carbon emissions, lower costs, and boost health. The BRESE project aims to accelerate these advancements for better building practices through community engagement, which will benefit people in the Southeastern region.”
The project is anticipated to produce significant benefits, including a conservative estimate of 10% improvement in residential and commercial building codes. This improvement is projected to yield cumulative savings of 47 trillion btu in energy, $1.1 billion in cost savings, and a reduction of 5.8 million metric tons of CO2 emissions over five years.
“The BRESE Collaborative is a pivotal investment in the Southeast’s energy future, fostering workforce development, pioneering efficiency-based policies, and strengthening our foundation for federal support. Through strategic partnerships and innovative solutions, we will drive meaningful change and position the Southeast as a leader in energy efficiency,” said Aimee Skrzekut, President and CEO of the Southeast Energy Efficiency Alliance (SEEA).
For more information about the BRESE Collaborative, please contact:
Senior Program Manager
Southeast Energy Efficiency Alliance (SEEA)
About SEEA:
The Southeast Energy Efficiency Alliance (SEEA) is a nonprofit organization committed to advancing energy efficiency in the Southeast to create a cleaner, more resilient, and equitable energy future. By fostering collaboration among diverse stakeholders and providing technical expertise, SEEA drives impactful energy efficiency initiatives across the region.
About Greenlink Analytics:
Greenlink Analytics (“Greenlink”) is an Atlanta-based clean energy and equity research non-profit organization equipped with sophisticated analytical technologies and deep industry knowledge in the clean energy space, receiving accolades from MIT, Georgia Tech, Yale, and the National Science Foundation, among others. It uses these technologies to help create a smarter, cleaner, and more equitable future.
Map of the Month – February
Laura Diaz-Villaquiran
Hover over the map to click through the slideshow. Click on image to view full image.
 Redlining and Tree Canopy in Memphis, Tennessee

")

Data Source: Mapping Inequality: Redlining in New Deal America Dataset; U.S. Forest Service Tree Canopy Cover (TCC) Dataset; Maps: SEEA.
Few things have impacted cities today as much as the suite of policies and practices that segregated neighborhoods on the basis of race over more than a century. Housing segregation had existed in practice for decades before the 1910s when white policymakers enacted the first racial zoning laws. Although these laws were declared unconstitutional by the United States Supreme Court in 1917, white city officials throughout the South still found ways to advance racial residential segregation.
In the 1920s and 1930s, segregation was taken up by the federal government in the form of “redlining,” the practice of denying financial lending – particularly for home purchases or improvements – to people based on their race or ethnicity and what neighborhood they lived in. For instance, the federal Home Owners’ Loan Corporation (HOLC) developed a series of maps that used the racial makeup of city neighborhoods to guide mortgage lending practices based on their assessment of the risk of lending. HOLC devised a four-tiered system that characterized neighborhoods in more than two hundred cities as A – best, B – still desirable, C – declining, and D – hazardous. These ratings were largely based on the racial makeup of a neighborhood, with C and D ratings typically having a larger share of racial and ethnic minorities than neighborhoods that rated A and B.
HOLC maps had less of an impact on private markets than often suggested, but they guided Federal Housing Administration (FHA) lending decisions for decades. Beyond that, they are also a spatial reflection of generations of policies and programs that segregated American cities, with far-reaching consequences that still shape cities today.
Using tree canopy cover data from the U.S. Forest Service, this month’s map explores the relationship between redlining and urban tree canopy. In three cities (Columbia, Jackson, and Memphis), we find that formerly redlined neighborhoods have about half the level of tree canopy today than historically white neighborhoods.
In Memphis, Tennessee, formerly redlined neighborhoods have an average tree canopy covering 20% of the neighborhood, while neighborhoods rated “A” have canopies that cover about 43% of their land area. In Jackson, Mississippi, formerly redlined neighborhoods had an average tree canopy of 24%, while neighborhoods rated “A” have 50% canopy cover. In Columbia, South Carolina, formerly redlined neighborhoods had 15% tree canopy, compared to 32% for non-redlined neighborhoods.
These findings are consistent with national studies, which demonstrate how the legacies of residential segregation continue to impact people of color. This results in uneven access to public greenspace, less shade from trees, hotter temperatures, and poor air quality which can lead to more heat-related illness and asthma rates. Increased temperatures can place higher energy demands and financial burdens on people living in these areas, which will further strain health and household budgets as extreme heat becomes more common in the next few decades.
These implications underscore the need for comprehensive energy efficiency, clean energy, and urban planning strategies to mitigate adverse impacts. They also show that energy efficiency is an intersectional issue that must be advanced through collaborative efforts across sectors, including energy, public health, urban planning, and development.
Map of the Month – December
Grace Parker
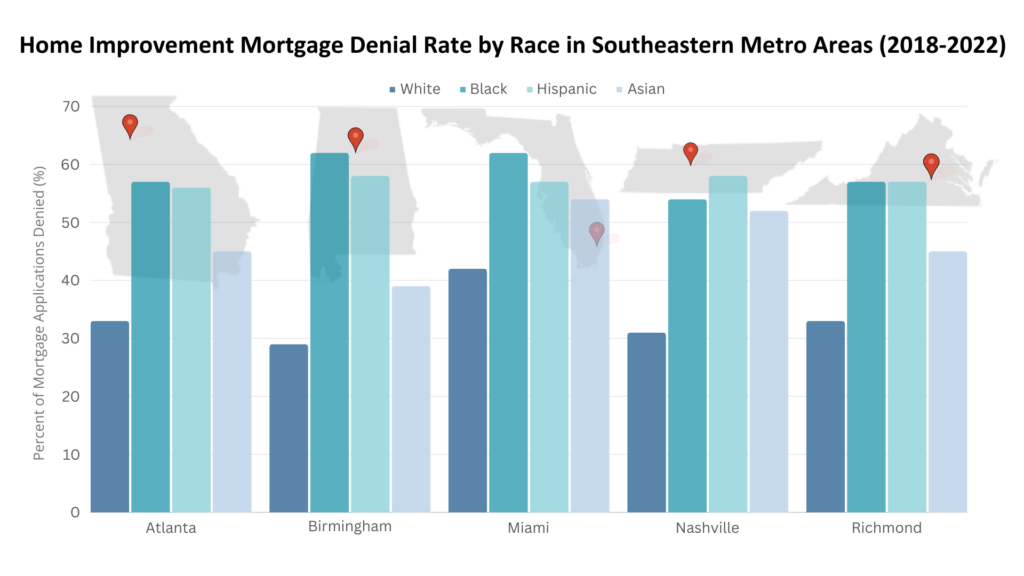
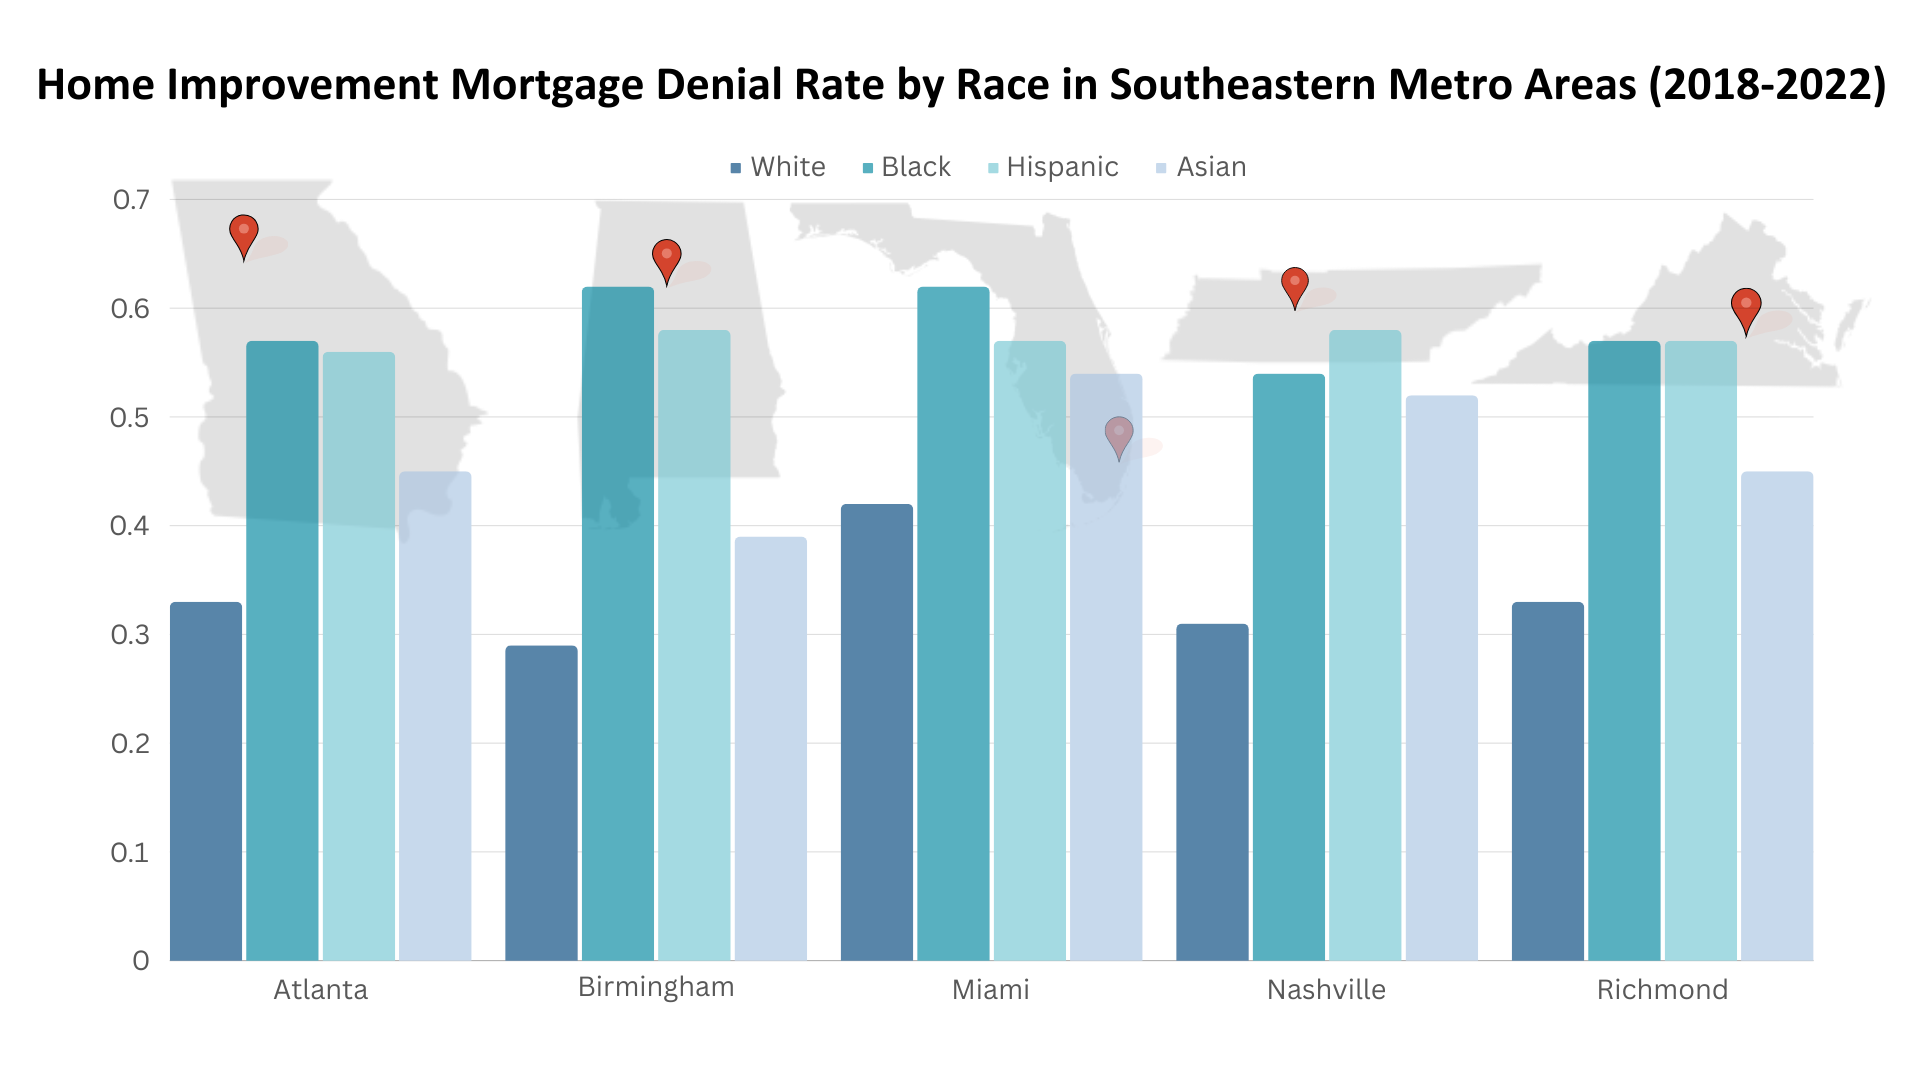
Source: Federal Financial Institutions Examination Council, Home Mortgage Disclosure Act Dataset; Graph: SEEA
Following last month’s map that explored home purchase mortgage denial rates by race, this month’s map shows home improvement mortgage denial rates by race in five Southeast cities: Atlanta, Birmingham, Miami, Nashville, and Richmond. Like mortgage loans for home purchases, we found wide disparities between racial groups in their ability to access lending for home improvements. Using data collected by the U.S. Consumer Financial Protection Bureau to ensure compliance with the Home Mortgage Disclosure Act, we discovered that the denial rate for home improvement loans in each city is highest for Black and Hispanic applicants, followed by Asian applicants, with white applicants experiencing the lowest rates. In Birmingham, the denial rate for Black applicants is twice that of white applicants.
In each of these cities, denial rates for home improvement mortgages are generally higher than those for home purchase mortgages. Home Mortgage Disclosure Act regulations consider home improvement loans as those that are “for the purpose, in whole or in part, of repairing, rehabilitating, remodeling, or improving a dwelling or the real property on which the dwelling is located.” This includes home improvement spending built into mortgages for home purchases or lines of credit opened for home improvement if the home itself is used as collateral on the loan.
According to the U.S. Census Bureau’s American Housing Survey, about a third of home improvements in the Southeast are for energy efficiency measures. Limited access to capital for home improvement hinders the ability of homeowners, particularly Black, Hispanic, and Asian homeowners, to make energy efficiency upgrades. This further contributes to racial disparities in energy costs and burdens and makes it more difficult for people of color to access healthy, efficient and affordable housing.
Map of the Month – November
Grace Parker
hover over the map to click through the slideshow
- Mortgage denials for white households.


Source: Dynamic National Loan-Level Dataset, U.S. Consumer Financial Protection Bureau; Maps: SEEA
Redlining and other forms of housing segregation officially ended in 1968 with the Fair Housing Act, but access to lending still differs depending on a person’s race. People of color are still more likely to be denied access to mortgage lending than white people. Homeownership is the most common pathway to building generational wealth in the United States and limiting access to capital for buying a home not only prevents people from healthy, safe, and affordable housing and inhibits social mobility.
This month’s map tracks disparities in mortgage lending throughout the Southeast using data collected from federally- backed lenders as part of the Home Mortgage Disclosure Act (HMDA). It shows the mortgage denial rate by race among counties in the Southeast between 2018 and 2022. As housing costs and high- interest rates raised monthly mortgage payments, lenders denied around 12 percent of home purchase mortgage applications in the Southeast. However, the applicants are not denied evenly. Between 2018 and 2022, about 10 percent of non-Hispanic white applicants, 8 percent of Asian applicants, 14 percent of Hispanic applicants, and 21 percent of Black applicants in the Southeast were denied mortgage loans.
In 2022, the most common reason for mortgage application denials was insufficient income. Income also varies by race. The median non-Hispanic, white household income in 2022 was $81,000; Asian household income was $109,000, Hispanic household income was $63,000, and Black household income was $53,000. Inequities in income, lending, and the ability to build wealth impact a household’s ability to access safe and healthy housing. A lack of mortgage capital also makes it difficult for people to access the benefits energy efficiency, whether through housing choice or home retrofits. Stay tuned for a forthcoming map on lending for home improvements, which will shed light on the ability of households to achieve energy efficiency savings through home improvement capital.
Map of the Month – October
Grace Parker
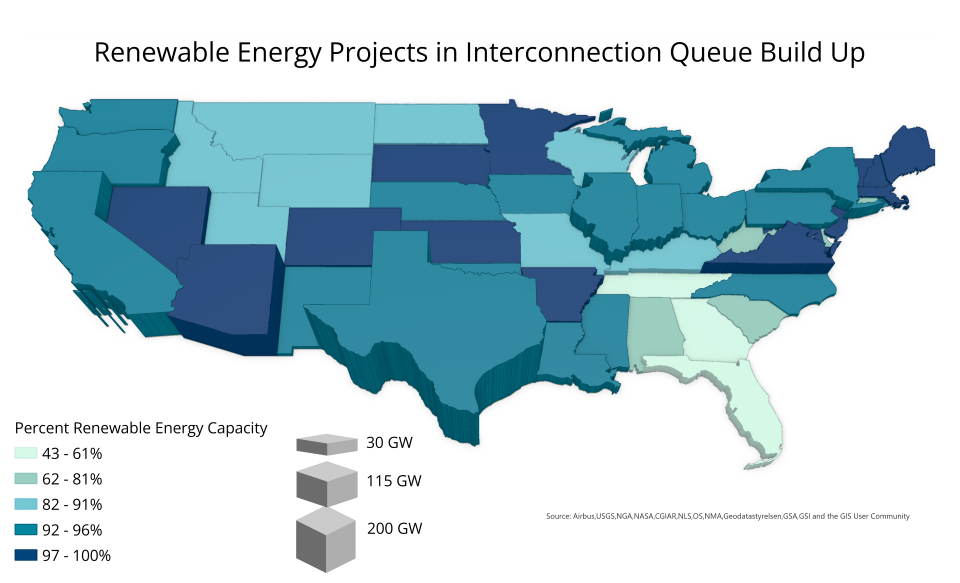
The Inflation Reduction Act (IRA) and other recent federal developments provide unprecedented opportunities to hasten the energy transition through the development of renewable energy resources. Yet this progress is being hindered by the backlog of energy projects waiting in the interconnection queue, a phase in which energy developers request to connect to the power grid and complete studies about the impact of these connections. The number of projects waiting in the nation’s interconnection queue grew by 40 percent in 2022 as more renewable energy projects were greenlit. The amount of time each project spends in the queue is also growing. Projects completed in 2022 spent an average of five years in the queue, compared to less than two years for projects completed in 2008.
These delays threaten project feasibility, potentially undermining the transition to renewable energy. During waiting periods, project terms, including how much consumers will pay for electricity and the availability and costs of proposed real estate, are likely to change, which leads to projects being abandoned. Less than a quarter of the projects in the queue are expected to be completed.
This month’s map shows the total capacity of energy projects in the queue for each state, and how much of each of this capacity is in renewable energy projects. The data, from Lawrence Berkeley National Laboratory, includes seven independent system operators and 35 utilities, representing about 85% of the U.S. electricity load.
Texas leads the country by far in total capacity in the queue with about 200 GW, followed by California and Arizona, with about 113 GW each. Interconnection queues are managed by regional transmission organizations and utilities, so the total capacity in the queue indicates both interest in building energy projects and the efficiency of queue managers.
The proportion of capacity that is renewable energy is high overall, with only seven states below 80 percent. The relatively large backlog of projects in the queue in other regions might be due in part to the lack of long-distance, high-capacity transmission lines on which renewable energy projects typically depend. Lacking this infrastructure, renewable projects are more challenging to connect to the grid, contributing to long periods in the queue.
The Federal Energy Regulatory Commission issued a rule reforming the interconnection process in July by streamlining permitting, instituting deadlines and fines for delayed assessments, and instituting financial requirements to cut down on speculative projects. But many experts still say that more system reform is needed to meet clean energy goals. While policymakers are working on additional changes to the interconnection process, energy efficiency upgrades are critical for preparing homes and commercial buildings to realize the maximum benefit of renewable energy supplies.
Map of the Month – February

William D. Bryan, Ph.D. & Joy Ward

Map: Southeast Energy Efficiency Alliance.
In honor of Black History Month, our February map pays homage to David Crosthwait, a Black engineer and inventor who designed heating, ventilation and air conditioning systems. One of his greatest contributions was developing heating systems for Rockefeller Center and Radio City Music Hall in New York. Today he is remembered for holding 39 patents that addressed a range of heating and ventilation problems. In 1971, he became the first Black person named a fellow of the American Society of Heating, Refrigeration, and Air Conditioning Engineers.
This month’s map visualizes the type of heating fuel households use at the county level across the United States for occupied housing units. It was created using data from the American Community Survey conducted by the U.S. Census Bureau.
Nationwide, most people rely on utility gas or electricity to heat their homes. Forty-seven percent of households use utility gas to fuel their heating equipment, while 39% use electricity. The remaining fuel types, bottled tank and fuel oil, are common in the Midwest and Northeast, respectively. In the South, electricity is most common with 68% of households using it as a source of heat, while just a quarter use utility gas.
One reason why the South has a high percentage of electricity use is because our region has a lower heating load and electric utilities have led successful heat pump installation programs. Despite this, urban centers such as Atlanta, Birmingham, Little Rock, Louisville, and Memphis predominately use utility gas. While this map suggests that the South is heavily electric, there are still millions of households in the Southeast that are eligible for the electric appliance tax credits and rebates available through the Inflation Reduction Act. These incentives can reduce the cost of energy efficient appliances like electric heat pumps, which are well-suited to the needs of Southern homes and dramatically reduce household energy consumption.
On March 15 at 2 p.m., hear from regional experts about how we can leverage federal funding to help low-income renters access energy efficient technology for their homes. Register for How to Make Clean Energy Upgrades More Accessible to Renters today.
Map of the Month – January
William D. Bryan, Ph.D. & Joy Ward
We are excited to introduce a new addition to SEEA’s blog this year – the Map of the Month. Every month, our research team will share a map that explores energy efficiency in the Southeast.
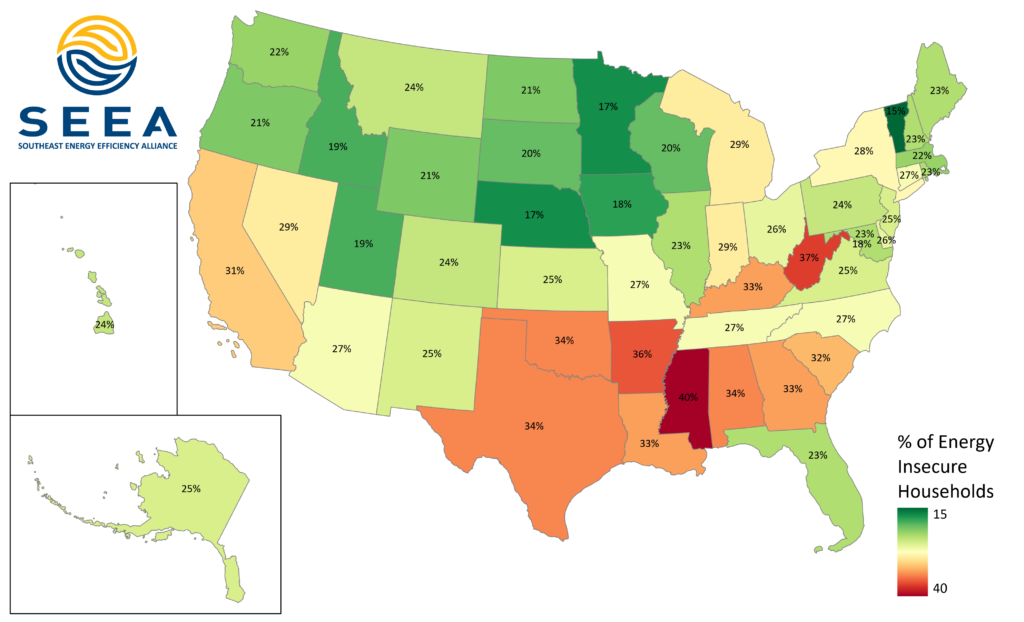
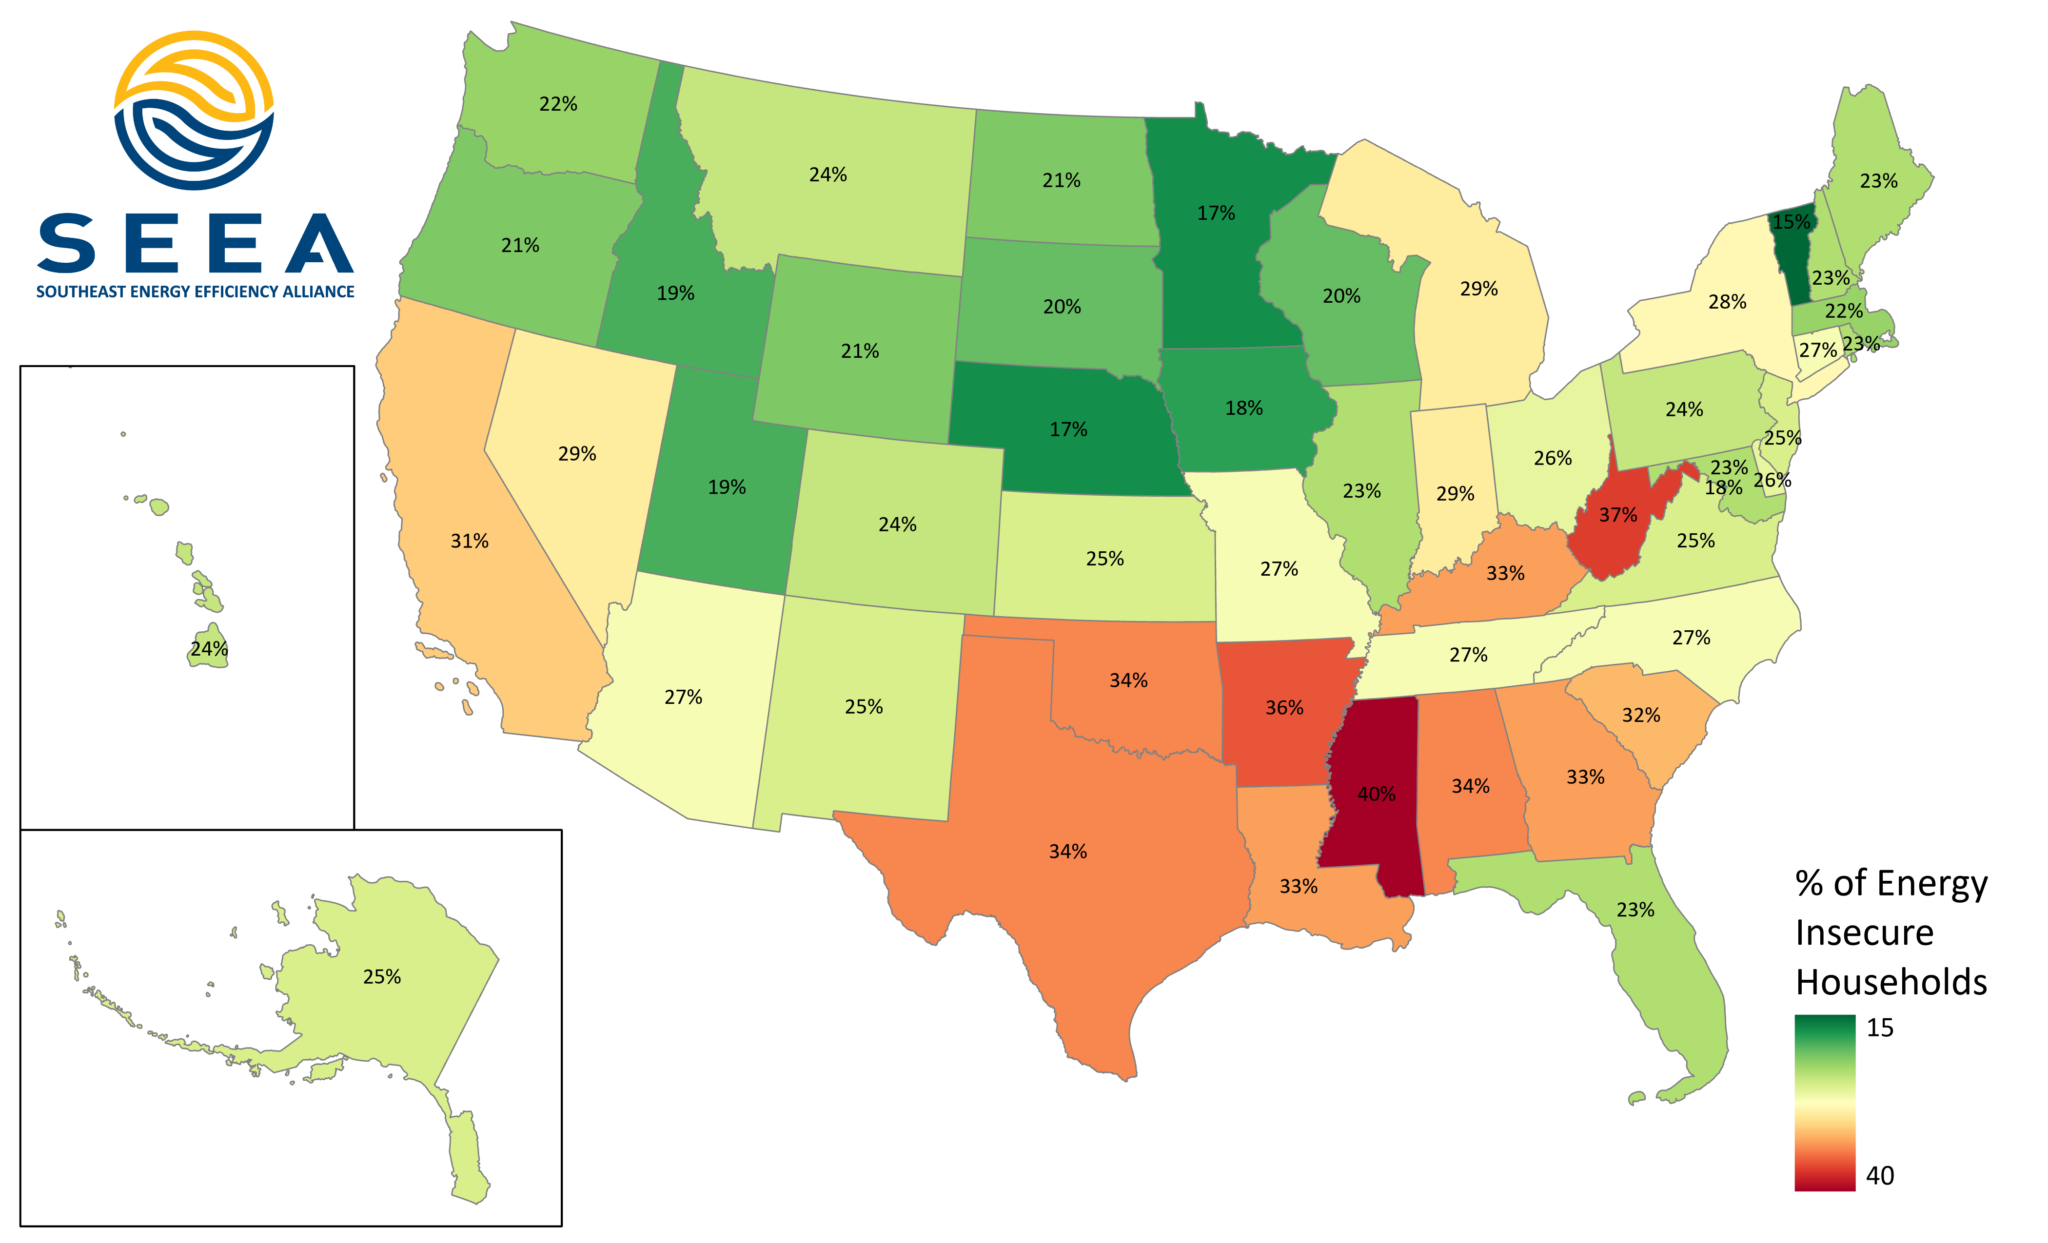
Map: Southeast Energy Efficiency Alliance.
Millions of people in the South who struggle to pay their electric and gas bills every month are threatened with energy insecurity, or when a household cannot maintain vital energy services like heating and cooling. Energy insecurity undermines the health, safety and affordability of housing. The COVID-19 pandemic has only exacerbated this crisis.
Using new state-level data from the Energy Information Administration’s 2020 Residential Energy Consumption Survey (RECS), this map shows that people living in the Southeast experience the highest rate of energy insecurity in the country. In Mississippi, where 2 out of 5 households struggle to keep on the lights and heat, people are more likely to be energy insecure than anywhere else in the U.S. Of the 9.3 million energy insecure homes in the Southeast, nearly one-third are in Florida and Georgia. People experiencing energy insecurity are at greater risk for respiratory illness, poverty, and being unable to survive or recover in the face of extreme weather.
Beginning with a report and StoryMap, published in 2021, our research team has led SEEA’s work in identifying the historical and current systemic issues that contribute to energy insecurity in the Southeast. In 2022, SEEA announced the Southeast Energy Insecurity Project and continues to advance energy efficiency as a mitigation tool to help people in the Southeast live in healthier, more comfortable homes. You can hear more about how to reduce energy insecurity in our upcoming webinar, Promoting Knowledge and Engagement – Addressing Energy Insecurity in the Gullah Community on Wednesday, Jan. 25 at 11 a.m. ET.
Southeast Energy Efficiency Alliance Announces Inaugural Energy Insecurity Project Implementation Awards
ATLANTA, GA – The Southeast Energy Efficiency Alliance (SEEA) today announced the winners of the inaugural Southeast Energy Insecurity Project Implementation Awards. The award winners were selected by the Southeast Energy Insecurity Project (SEIP) Leadership Forum. The project was formerly housed at Duke University’s Nicholas Institute for Environmental Policy Solutions.
Sabrina Cowden, principal at Sabrina Cowden Consulting and a member of the Leadership Forum, said, “The award winners are doing the hard work of developing and implementing programs that facilitate better access to energy assistance. We are excited to support projects that provide meaningful pathways to address energy insecurity and can be held up as program models throughout the Southeast.” The awards are as follows:
The City of Savannah (GA) Office of Sustainability & the Athens-Clarke County (GA) Unified Government Sustainability Office
These governments were selected for a shared $10,000 award to support a project that will expand access to Georgia Power’s Home Energy Efficiency Assistance Program (HEEAP), an energy efficiency assistance program for income-qualified customers. This project will promote and explain the HEEAP to the community. The project team will also collect data on observed barriers to participation. This data will be brought to the Georgia Public Service Commission’s Demand Side Management Working Group, which advises both the commission and Georgia Power on existing and future energy efficiency programs, with the goal of lowering participation barriers for Georgia Power customers.
Alicia Brown, the clean energy program manager for the City of Savannah said, “I’m very excited for the opportunity partner with my friends in Athens-Clarke County. There are energy efficiency programs available today, that customers pay for on every power bill, that are not used as much as they should be simply because people don’t know they exist. Our goal is to spend the next four months changing that narrative in our respective communities and collecting insights to take back to the Public Service Commission to make these programs even more effective for those who need the assistance most.”
The Sustainability Institute (Charleston, SC)
This organization was selected to receive a $12,500 award to support a project that will identify and address health and safety challenges that prevent access to energy assistance and launch an awareness campaign to educate energy insecure communities and decision-makers. This project is focused on four underserved communities in North Charleston, SC that have a high number of aging homes and high energy burdens. This project will help develop a program that identifies homes that need repairs before they can receive weatherization upgrades. Project partners and AmeriCorps staff will support raising community awareness and outreach.
The Sustainability Institute’s project partners include the Lowcountry Alliance for Model Communities (LAMC), Liberty Hill Improvement Council, Charleston Area Affordable Housing Coalition, Charleston County Government, Charleston Climate Coalition, and the South Carolina Energy Justice Roundtable.
Bryan Cordell, executive director of the Sustainability Institute, said, “So many families in our region are not only spending more than they can afford to heat and cool their homes, they are also facing home health and safety challenges that prevent efficiency repairs from ever being implemented. We are excited for the opportunity to work with underserved communities to better understand the challenges families are facing so that we can build a programmatic model that holistically addresses those needs. We believe that weatherizing homes is critically important work. The optimal outcome pairs energy upgrades with a healthy and safe living environment and also engages and empowers families.”
##
Questions? Contact Sarah Burgher, senior marketing and communications manager.
Happy Heat Pump Water Heater Day!
Today is the first-ever Heat Pump Water Heater Day, dedicated to heat pump water heater (HPWH) education and awareness. Join us on social media (Twitter, Linkedin, Facebook, Instagram) using the hashtag #HeatPumpItUp to share your HPWH resources, products, cost information, professional practices, projects, and insights on why you think this is a game changing technology.
High performance building technology is a key piece to accelerating the growth of efficient energy in the Southeast. Heat pump water heaters provide exceptional support for households and businesses across the region. Their design and function make them especially useful in the Southeast’s hot and humid climate as they move heat from the surrounding space into the hot water tank. Water heating accounts for a large share of energy use in buildings—up to 32% in single-family and multifamily homes. Decreasing the amount of energy used to heat water with a HPWH decreases utility bills while maintaining on-demand hot water needed for daily life.
On average, HPWHs have higher initial costs than traditional electric-resistance water heaters used in approximately 68% of southeastern homes. However, there are federal, state, and utility rebates to offset the purchase cost available now and more coming in 2023. When those investments are combined with energy savings, the incremental increase in cost can quickly be recaptured. Through the Inflation Reduction Act, home and building owners can expect to see tax-credits of up to $2,000 and income-qualified rebates of $1,750 for the purchase and installation of Heat Pump Water Heaters.
Increasing the use of HPWH technology is critical in the pursuit of equitable electrification and ensuring everyone has access to affordable energy. Hot water is integral to daily life, and all people deserve to have affordable, safe hot water. Because nearly all homes use a water heater and they will all likely need to be replaced by 2035, Heat Pump Water Heaters are an ideal appliance for reducing energy use, carbon emissions and utility bills. Alleviating upfront costs, building awareness and developing a more knowledgeable workforce are critical for the widespread adoption of HPWHs.
SEEA is working to increase the adoption of Heat Pump Water Heaters in the Southeast. We are a proud supporting member of the Advanced Water Heating Initiative, where we strive to lift up voices, needs and innovation in the region. SEEA is also partnering with AZS Consulting in FL and Viridiant in VA on the Advanced Energy Ready Workforce Southeast project to develop technical expertise, improve customer comfort, lower energy costs and advance economic growth in the region.
If you are interested in learning more about our work on buildings and advanced technologies, contact Maggie Kelley Riggins, senior program manager.
Southeast Energy Efficiency Alliance to Launch Smart Manufacturing and Energy Management Systems Pilot Program
ATLANTA, GA – The Southeast Energy Efficiency Alliance (SEEA) is pleased to announce its award of $500,000 through the Technical Partnerships Opportunity from the U.S. Department of Energy (DOE) Advanced Manufacturing Office. This award establishes a regional two-year pilot initiative that will test technical assistance and workforce development practices to catalyze greater uptake and integration of smart manufacturing technologies and enhanced energy management practices. The Southeast Smart and Efficient Manufacturing Collaborative comprised of SEEA, Georgia Institute of Technology Manufacturing Extension Partnership, Advanced Energy, Association of Energy Engineers, 50001 Strategies LLC, Clemson University Center for Advanced Manufacturing and CESMII, The Smart Manufacturing Institute. The collaborative will provide awareness, education, training, instructor training and consultation services to the regional manufacturing energy management workforce and educate stakeholders on the benefits of smart manufacturing technologies and best practices on how to integrate systems into the sector.
Founded in 2007, SEEA is a nonprofit, regional energy efficiency organization based in Atlanta, GA. We believe that all people in the Southeast should be able to live and work in healthy and resilient buildings, utilize clean and affordable transportation, and thrive in a robust and equitable economy. We provide research, consultation and education, program management, and financial services to a diverse set of allies in the energy sector. SEEA represents more than 80 member organizations across the Southeast from utilities to state energy offices, service providers, manufacturers and advocates invested in building a more efficient, equitable and sustainable Southeast. With our members and partners, SEEA has delivered energy efficiency-related trainings to thousands of service providers in the region.
“This pilot program supports the advancement of the next generation of advanced manufacturing in the Southeast. It will help the sector evaluate and integrate the latest smart manufacturing technologies, systematic energy management practices and emerging sustainable manufacturing practices,” said SEEA director of technology and market solutions, Sydney G. Roberts.
Questions? Contact Sarah Burgher, senior marketing and communications manager.