Map of the Month – December

Grace Parker

Source: Federal Financial Institutions Examination Council, Home Mortgage Disclosure Act Dataset; Graph: SEEA
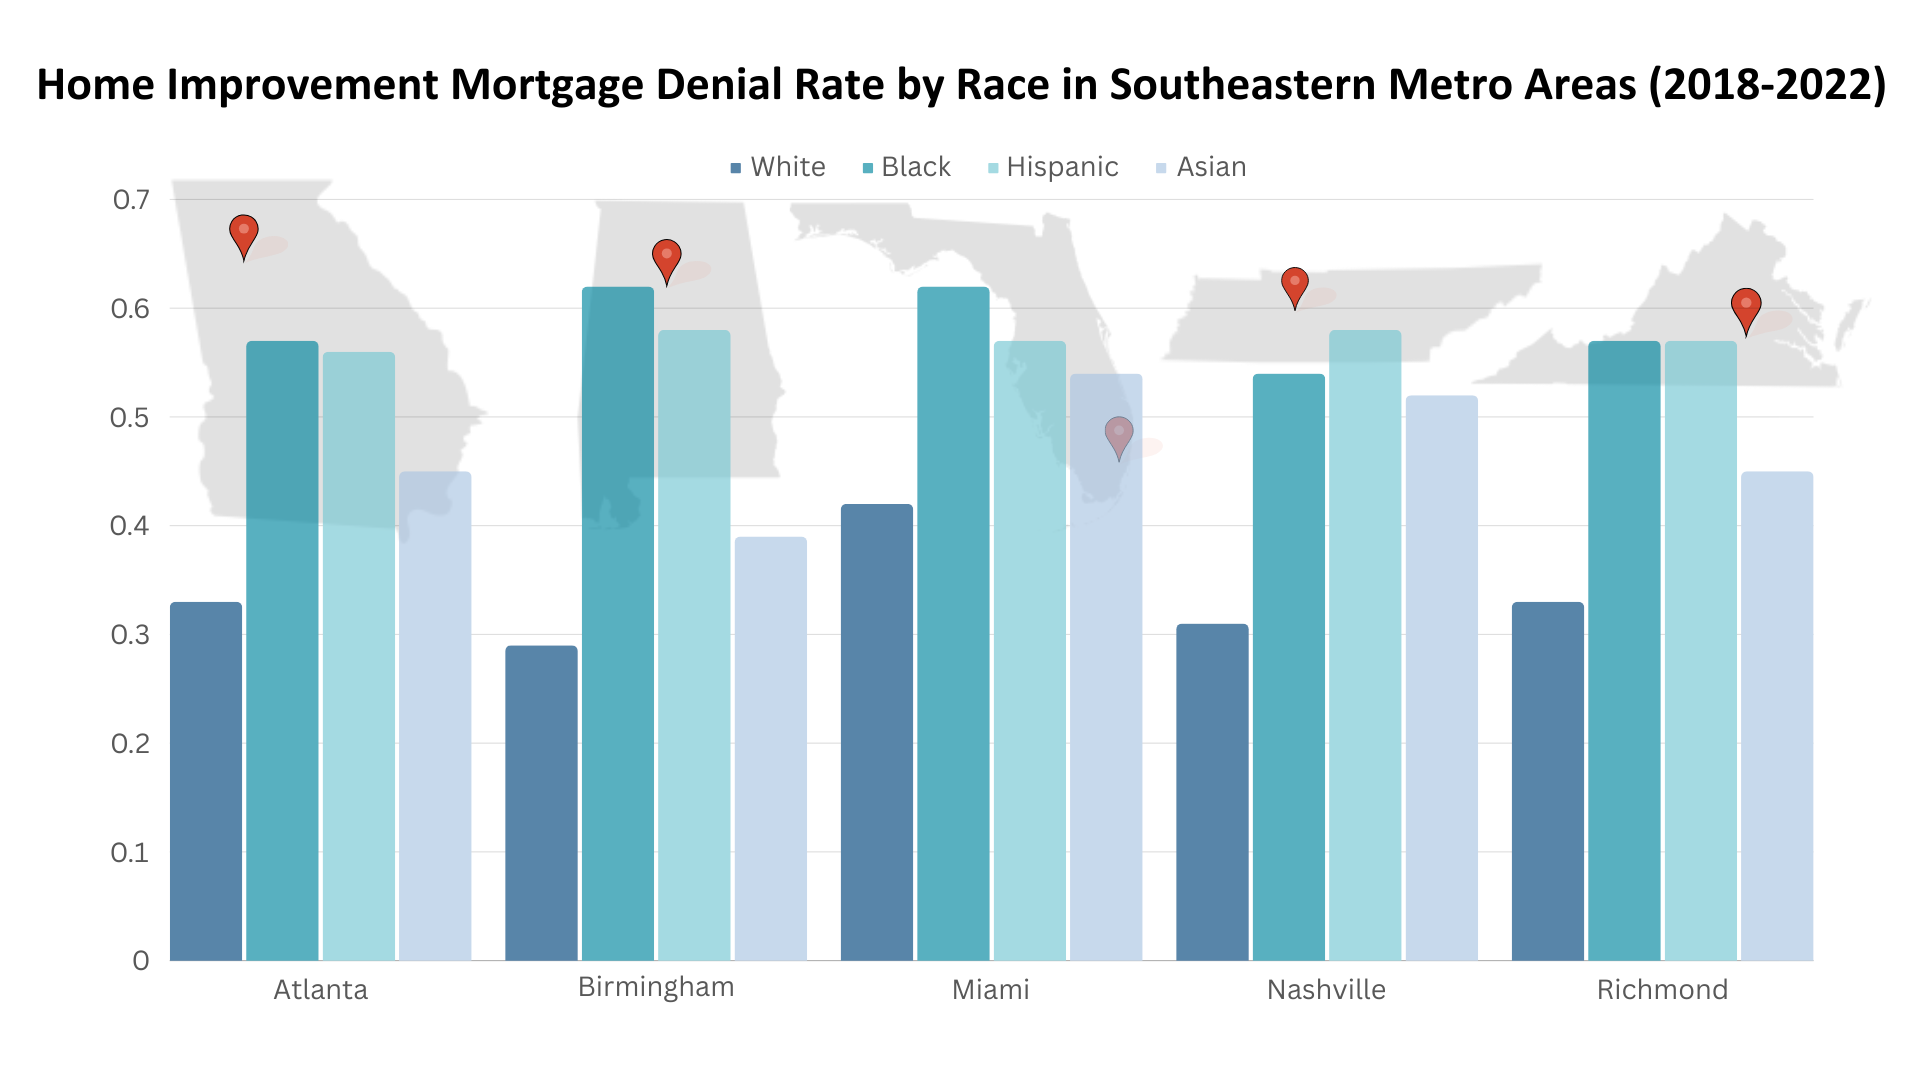
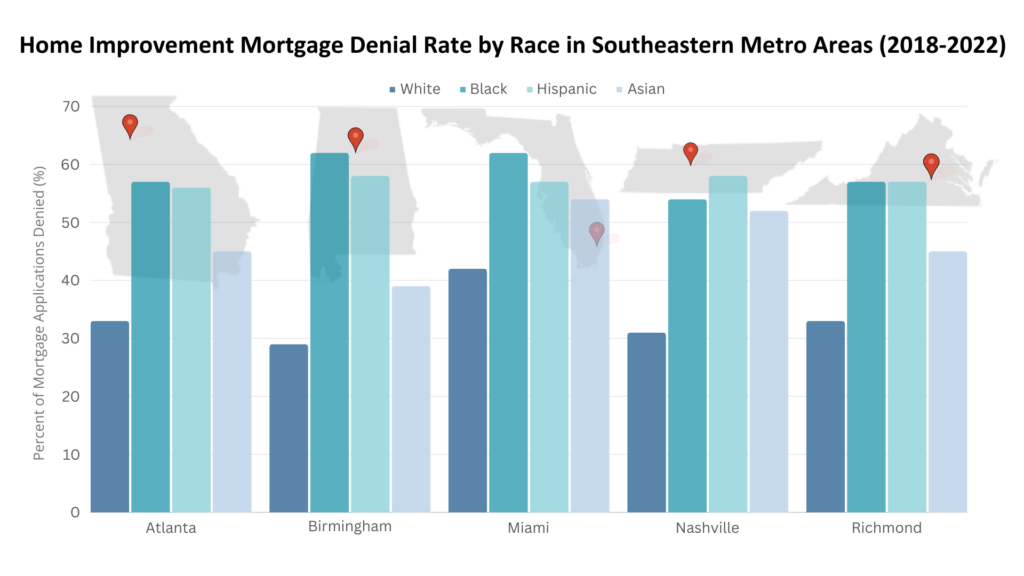
Following last month’s map that explored home purchase mortgage denial rates by race, this month’s map shows home improvement mortgage denial rates by race in five Southeast cities: Atlanta, Birmingham, Miami, Nashville, and Richmond. Like mortgage loans for home purchases, we found wide disparities between racial groups in their ability to access lending for home improvements. Using data collected by the U.S. Consumer Financial Protection Bureau to ensure compliance with the Home Mortgage Disclosure Act, we discovered that the denial rate for home improvement loans in each city is highest for Black and Hispanic applicants, followed by Asian applicants, with white applicants experiencing the lowest rates. In Birmingham, the denial rate for Black applicants is twice that of white applicants.
In each of these cities, denial rates for home improvement mortgages are generally higher than those for home purchase mortgages. Home Mortgage Disclosure Act regulations consider home improvement loans as those that are “for the purpose, in whole or in part, of repairing, rehabilitating, remodeling, or improving a dwelling or the real property on which the dwelling is located.” This includes home improvement spending built into mortgages for home purchases or lines of credit opened for home improvement if the home itself is used as collateral on the loan.
According to the U.S. Census Bureau’s American Housing Survey, about a third of home improvements in the Southeast are for energy efficiency measures. Limited access to capital for home improvement hinders the ability of homeowners, particularly Black, Hispanic, and Asian homeowners, to make energy efficiency upgrades. This further contributes to racial disparities in energy costs and burdens and makes it more difficult for people of color to access healthy, efficient and affordable housing.

