March Map of the Month
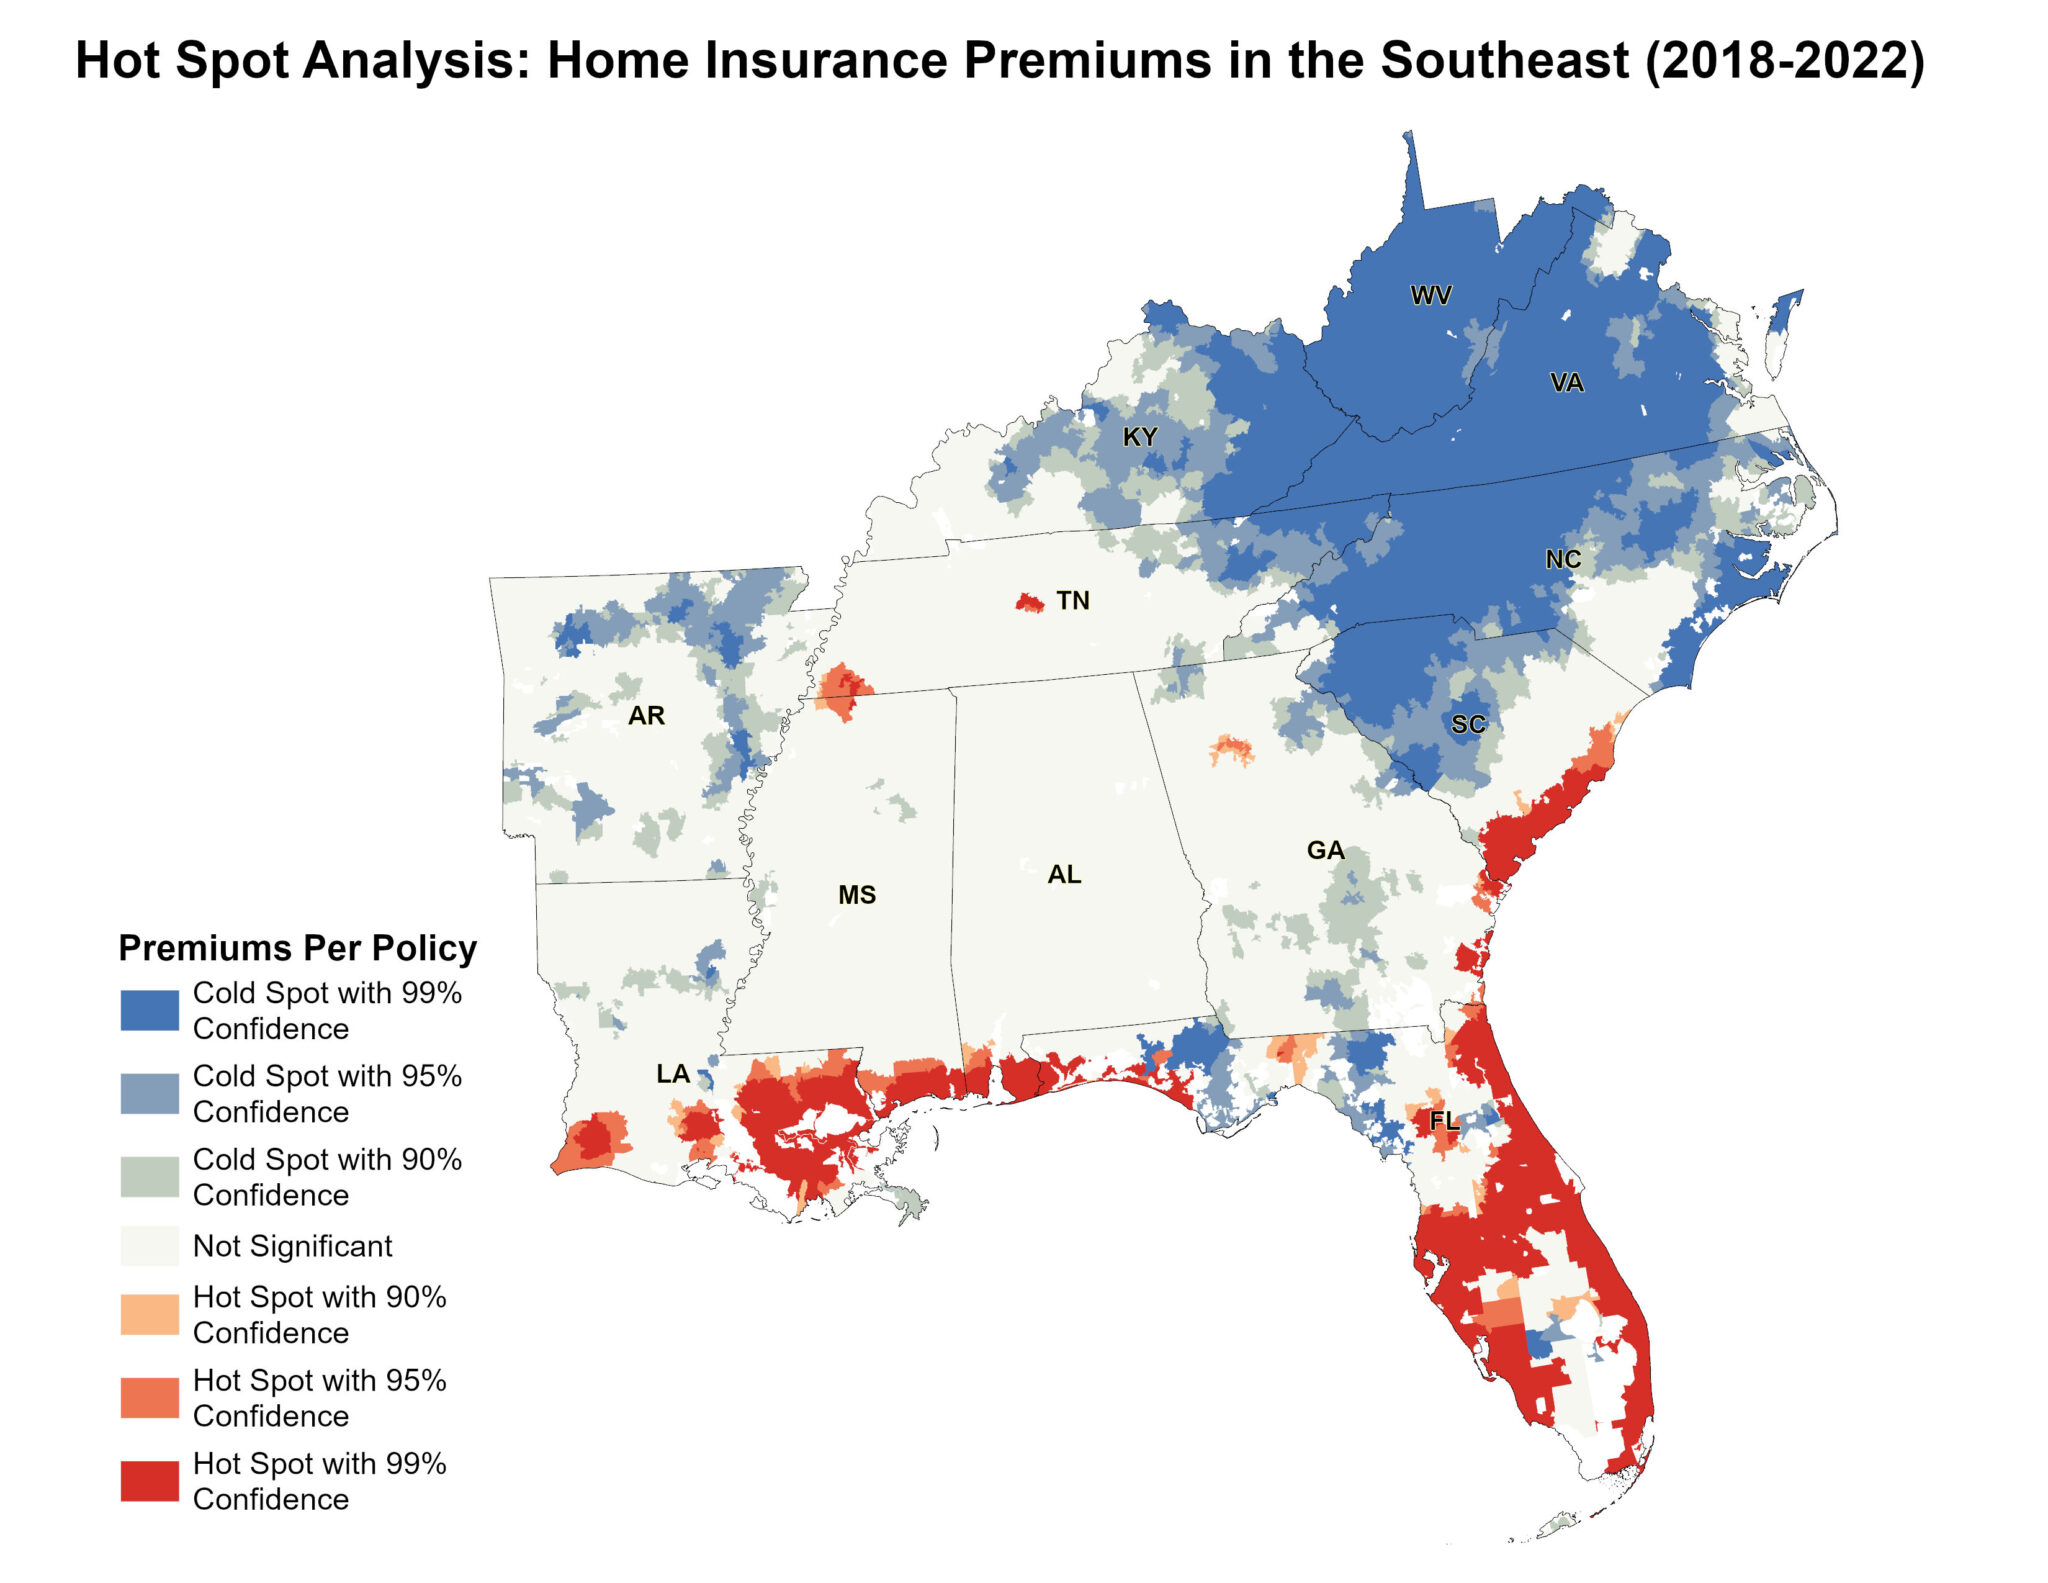
Home insurance costs are rising across the Southeast, threatening housing affordability for homeowners and renters alike. With the frequency and severity of climate-related disasters increasing, insurers are passing higher costs onto policyholders. Between 2018 and 2022, home insurance premiums written by the top 10 insurers in the region surged from $9.4 billion to $14.3 billion. Florida and Louisiana have been hit particularly hard and have some of the highest premium increases and non-renewal rates in the country.
February Map of the Month
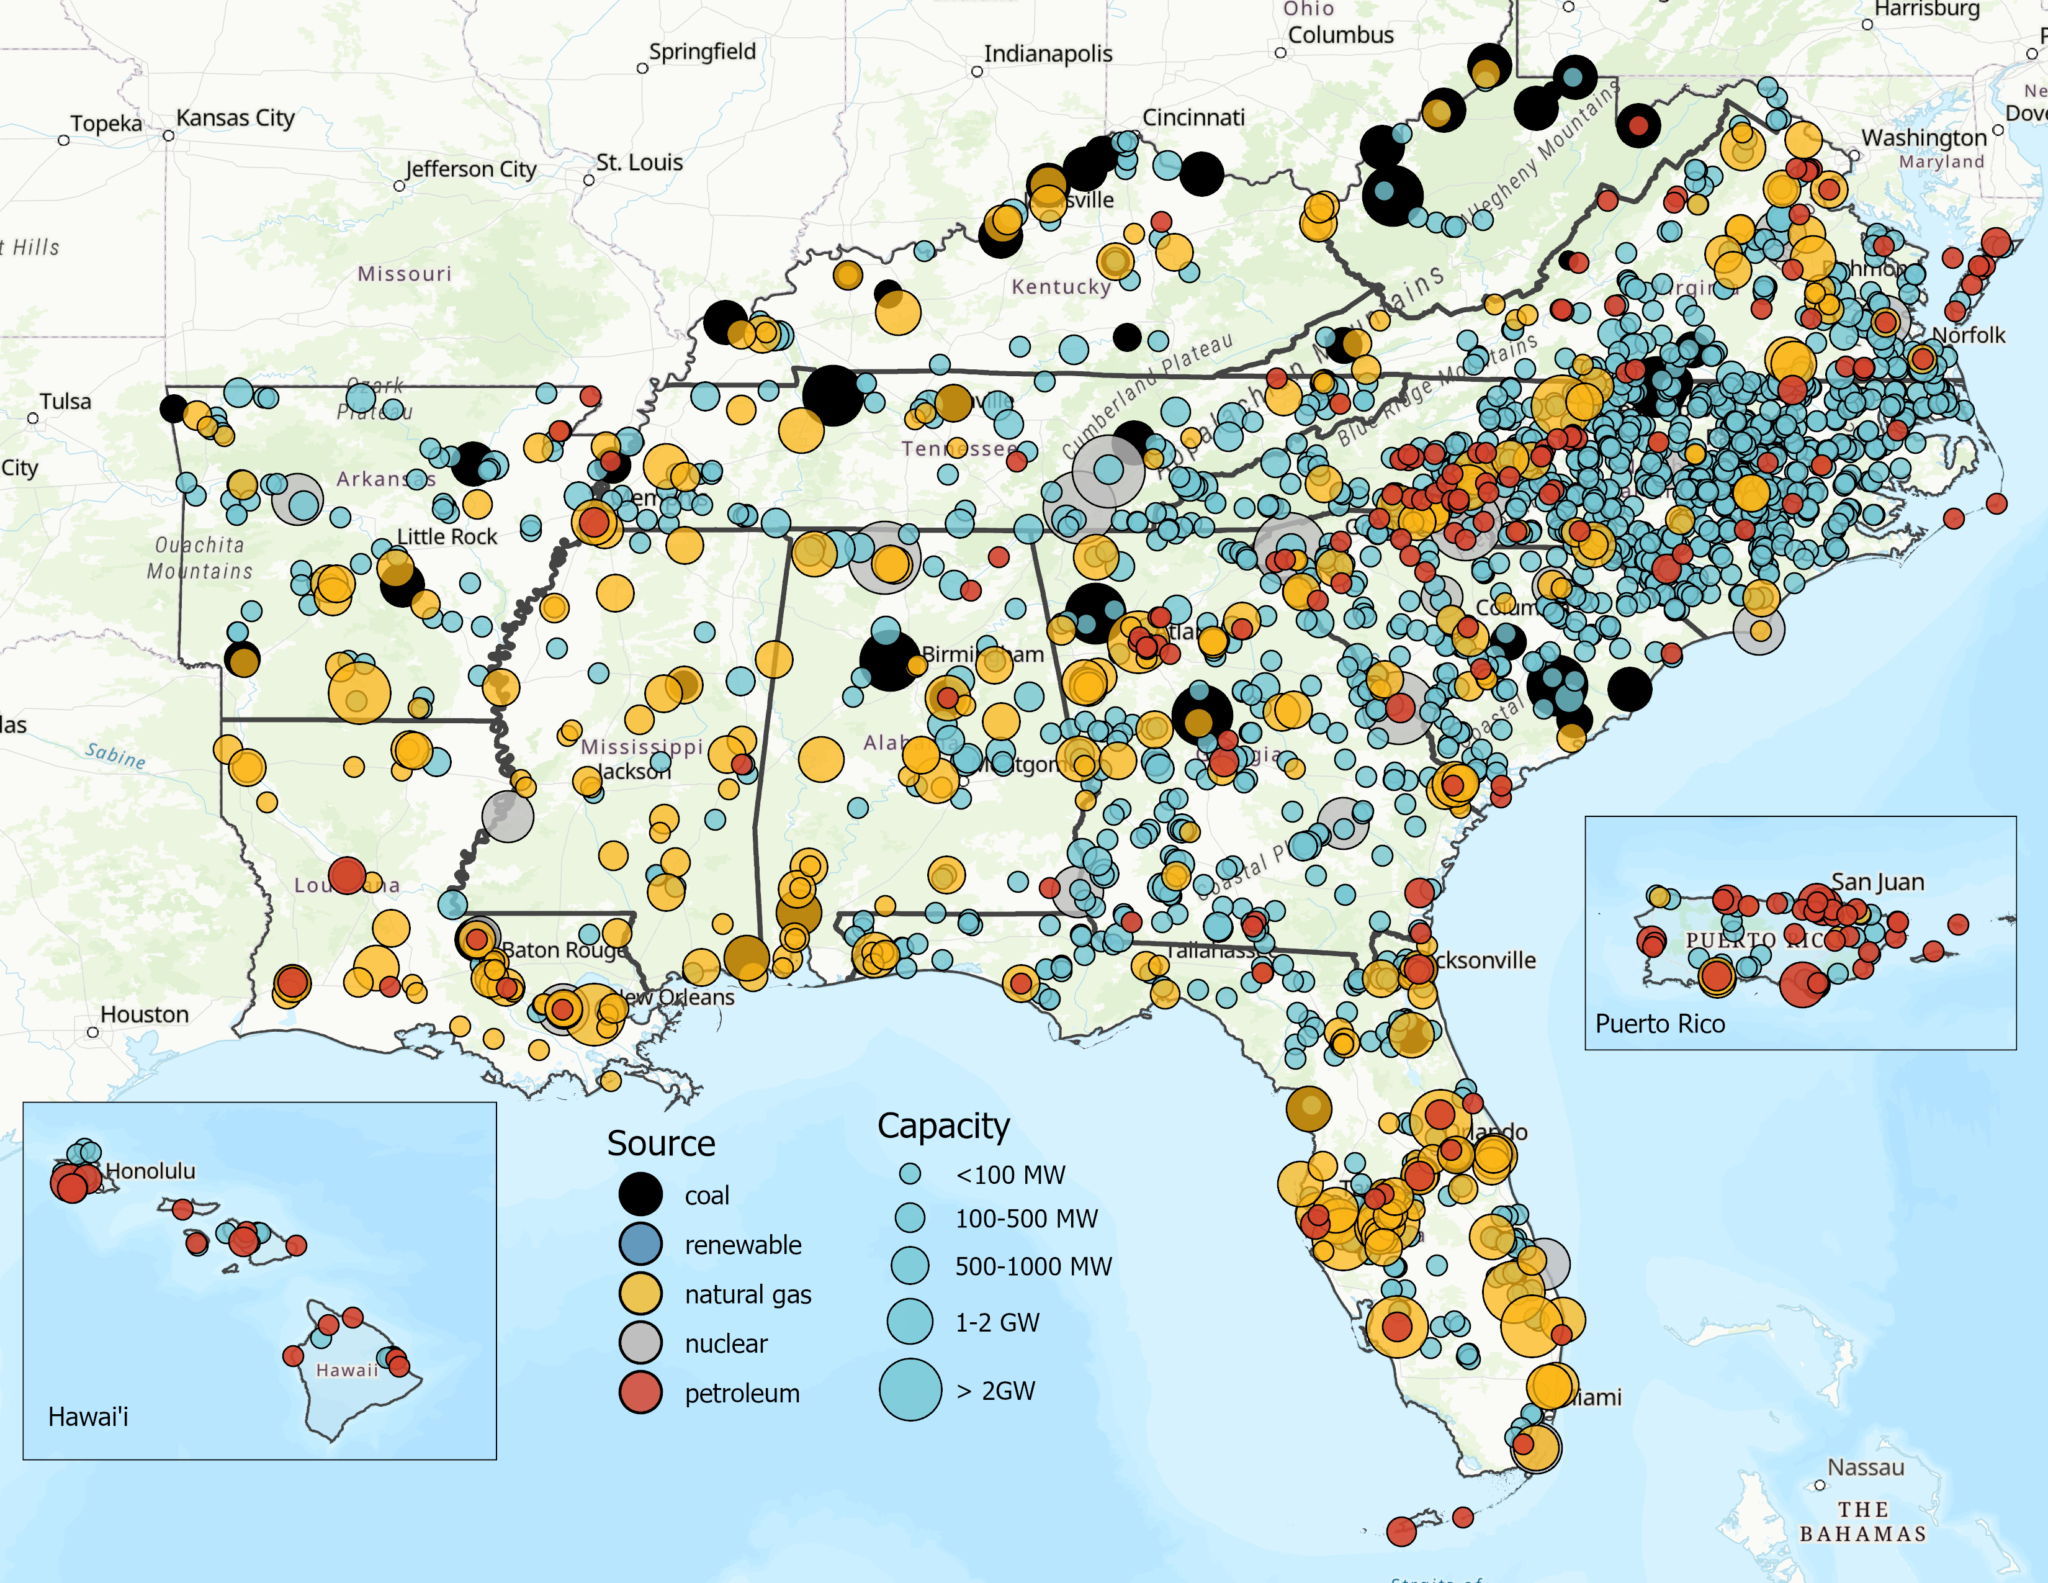
This month’s map considers the implications of this unprecedented load growth in the South. We use data from the U.S. Energy Information Administration (EIA) to review how Southern utilities currently generate power, as well as the expected energy and financial implications of new generation infrastructure that will be required to meet these needs.
Lauren Casentini Appointed 2025 Chair of the Southeast Energy Efficiency Alliance (SEEA)
The Southeast Energy Efficiency Alliance (SEEA) and Resource Innovations are pleased to announce that Lauren Casentini, Chief Executive Officer at Resource Innovations, has been named Chair of the SEEA Board of Directors for 2025. As Founder and CEO of Resource Innovations, and former executive and board member for the largest energy efficiency firm in the U.S., she’s changing how utilities navigate the clean energy transition. With a proven track record of innovation, scale, and impact, Lauren has been recognized four times on the Inc. 5000 list of fastest-growing private companies, a recognition awarded to less than 6% of companies.
January Map of the Month
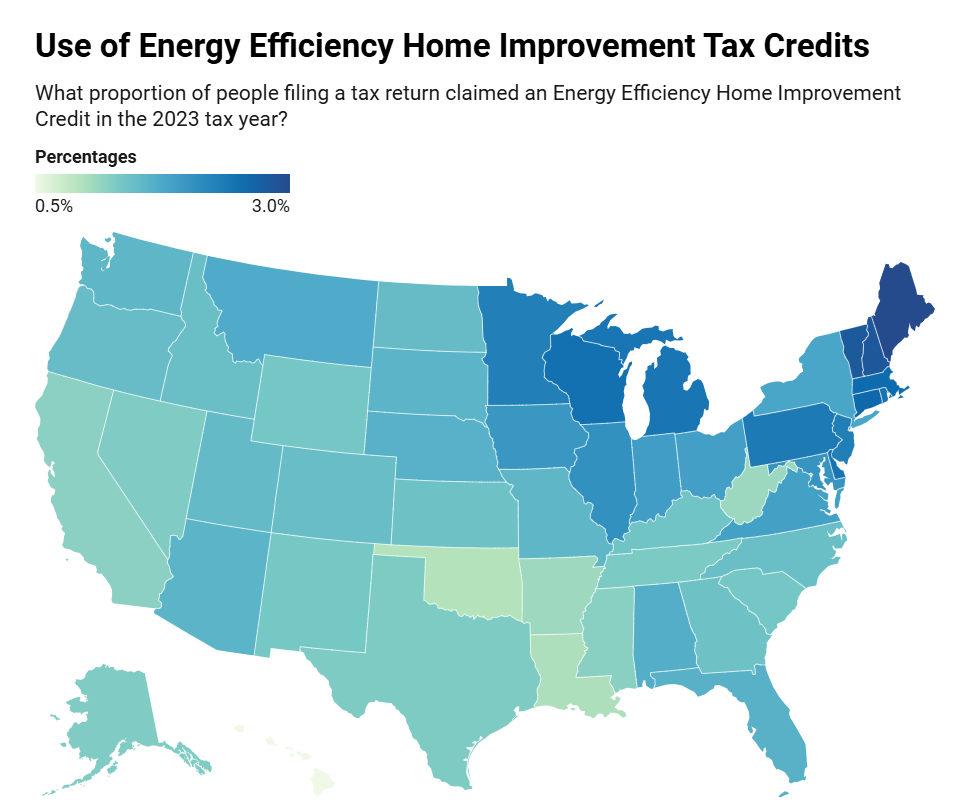
Tax season is fast approaching, and if you have invested in energy efficiency upgrades to your home over the past year you may be eligible for a federal tax credit that can offset some of your costs. The Energy Efficiency Home Improvement Credit, sometimes called the 25(c) credit, provides an annual tax credit of up to $3,200 for qualifying households that have invested in energy efficiency improvements since 2023. This includes up to $1,200 for efficient doors, windows, skylights, insulation, air sealing as well as for home energy audits. It also includes up to $2,000 per year for certain heat pumps, water heaters, or for stoves and/or boilers powered by biomass. Using data from the Internal Revenue Service (IRS), this Map of the Month explores the impact of these tax credits.
Buildings Blueprint (4th Quarter)
By Olivia Begalla & Elizabeth Willis Buildings Blueprint October – December 2024 What SEEA Staff is Reading — Energy for All Y’all shares powerful stories of communities driving energy equity […]
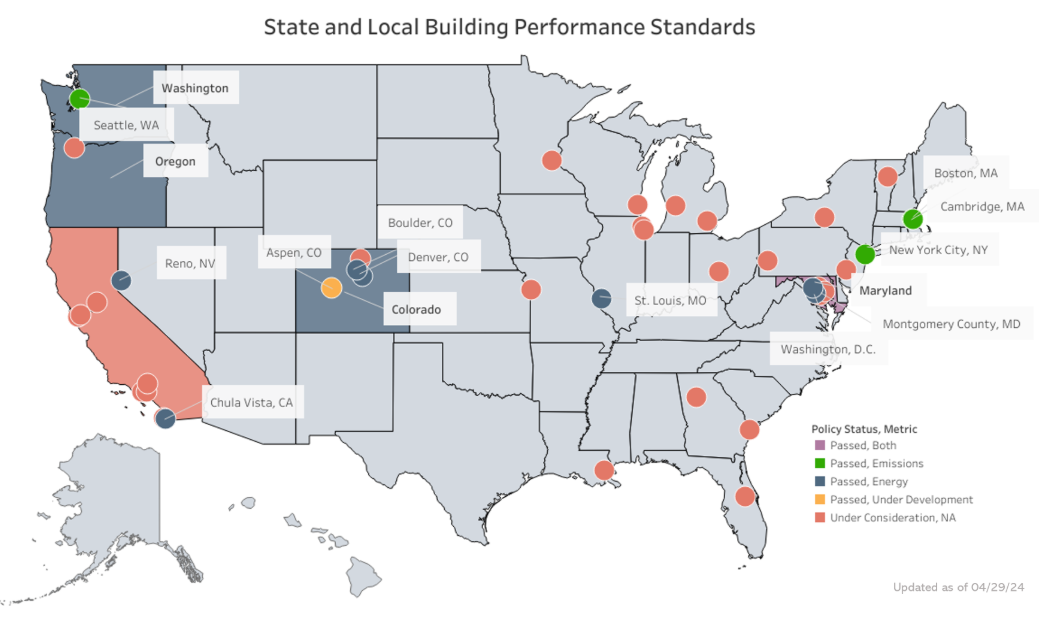
Building Performance Standards (BPS): Driving Energy Efficiency and Decarbonization in Existing Buildings
As cities and states across the U.S. begin implementing ambitious climate plans, Building Performance Standards (BPS) are emerging as a powerful and effective policy tool. By focusing on improving the energy efficiency of existing buildings, BPS policies fill a gap that traditional building codes—primarily aimed at new construction—fail to address.
Why We Should Insulate Homes
Building insulation is a critical component of energy-efficient design, providing resistance to heat flow to enhance the overall comfort and efficiency of a home. Proper insulation helps maintain a stable indoor temperature, reducing the need for heating in the winter and cooling in the summer. This not only improves comfort but also significantly lowers energy bills and decreases environmental impact by reducing energy consumption.
December Map of the Month
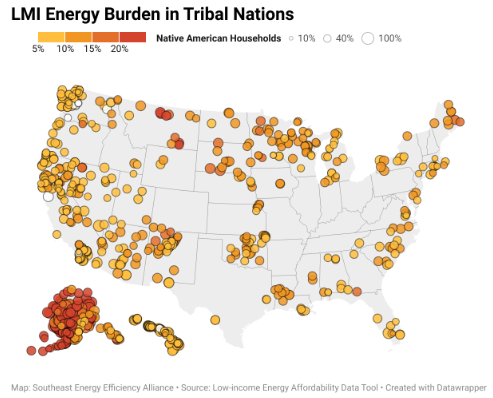
By Laura Diaz-Villaquiran Source: U.S. Census Bureau – American Indian, Alaska Native, and Native Hawaiian Areas (AIANNHAs). U.S. Department of Energy – Low-Income Energy Affordability Data Tool (LEAD). Native American communities […]
Nonprofits for unincorporated Norcross acquire $19.95 million EPA Community Change Grant
The Lucky Shoals Community Association (LSCA) – with partners Gwinnett Housing Corporation (GHC), Georgia Hispanic Construction Association (GHCA), and Southeast Energy Efficiency Alliance (SEEA) – have acquired a $19.95 million Community Change Grant from the U.S. Environmental Protection Agency.
2024 Southeast Energy Summit Member Testimonial
As a new SEEA member, I was excited to experience for myself all of the great things I had heard about the Summit from my colleagues in the region. I was also eager to see if anyone else was feeling uncertain about how the incoming administration might affect our industry.


