
Month: January 2024
Map of the Month – January
Grace Parker
Data Source: EIA Annual Electric Power Industry Report Form EIA-861 Dataset; Graph: SEEA
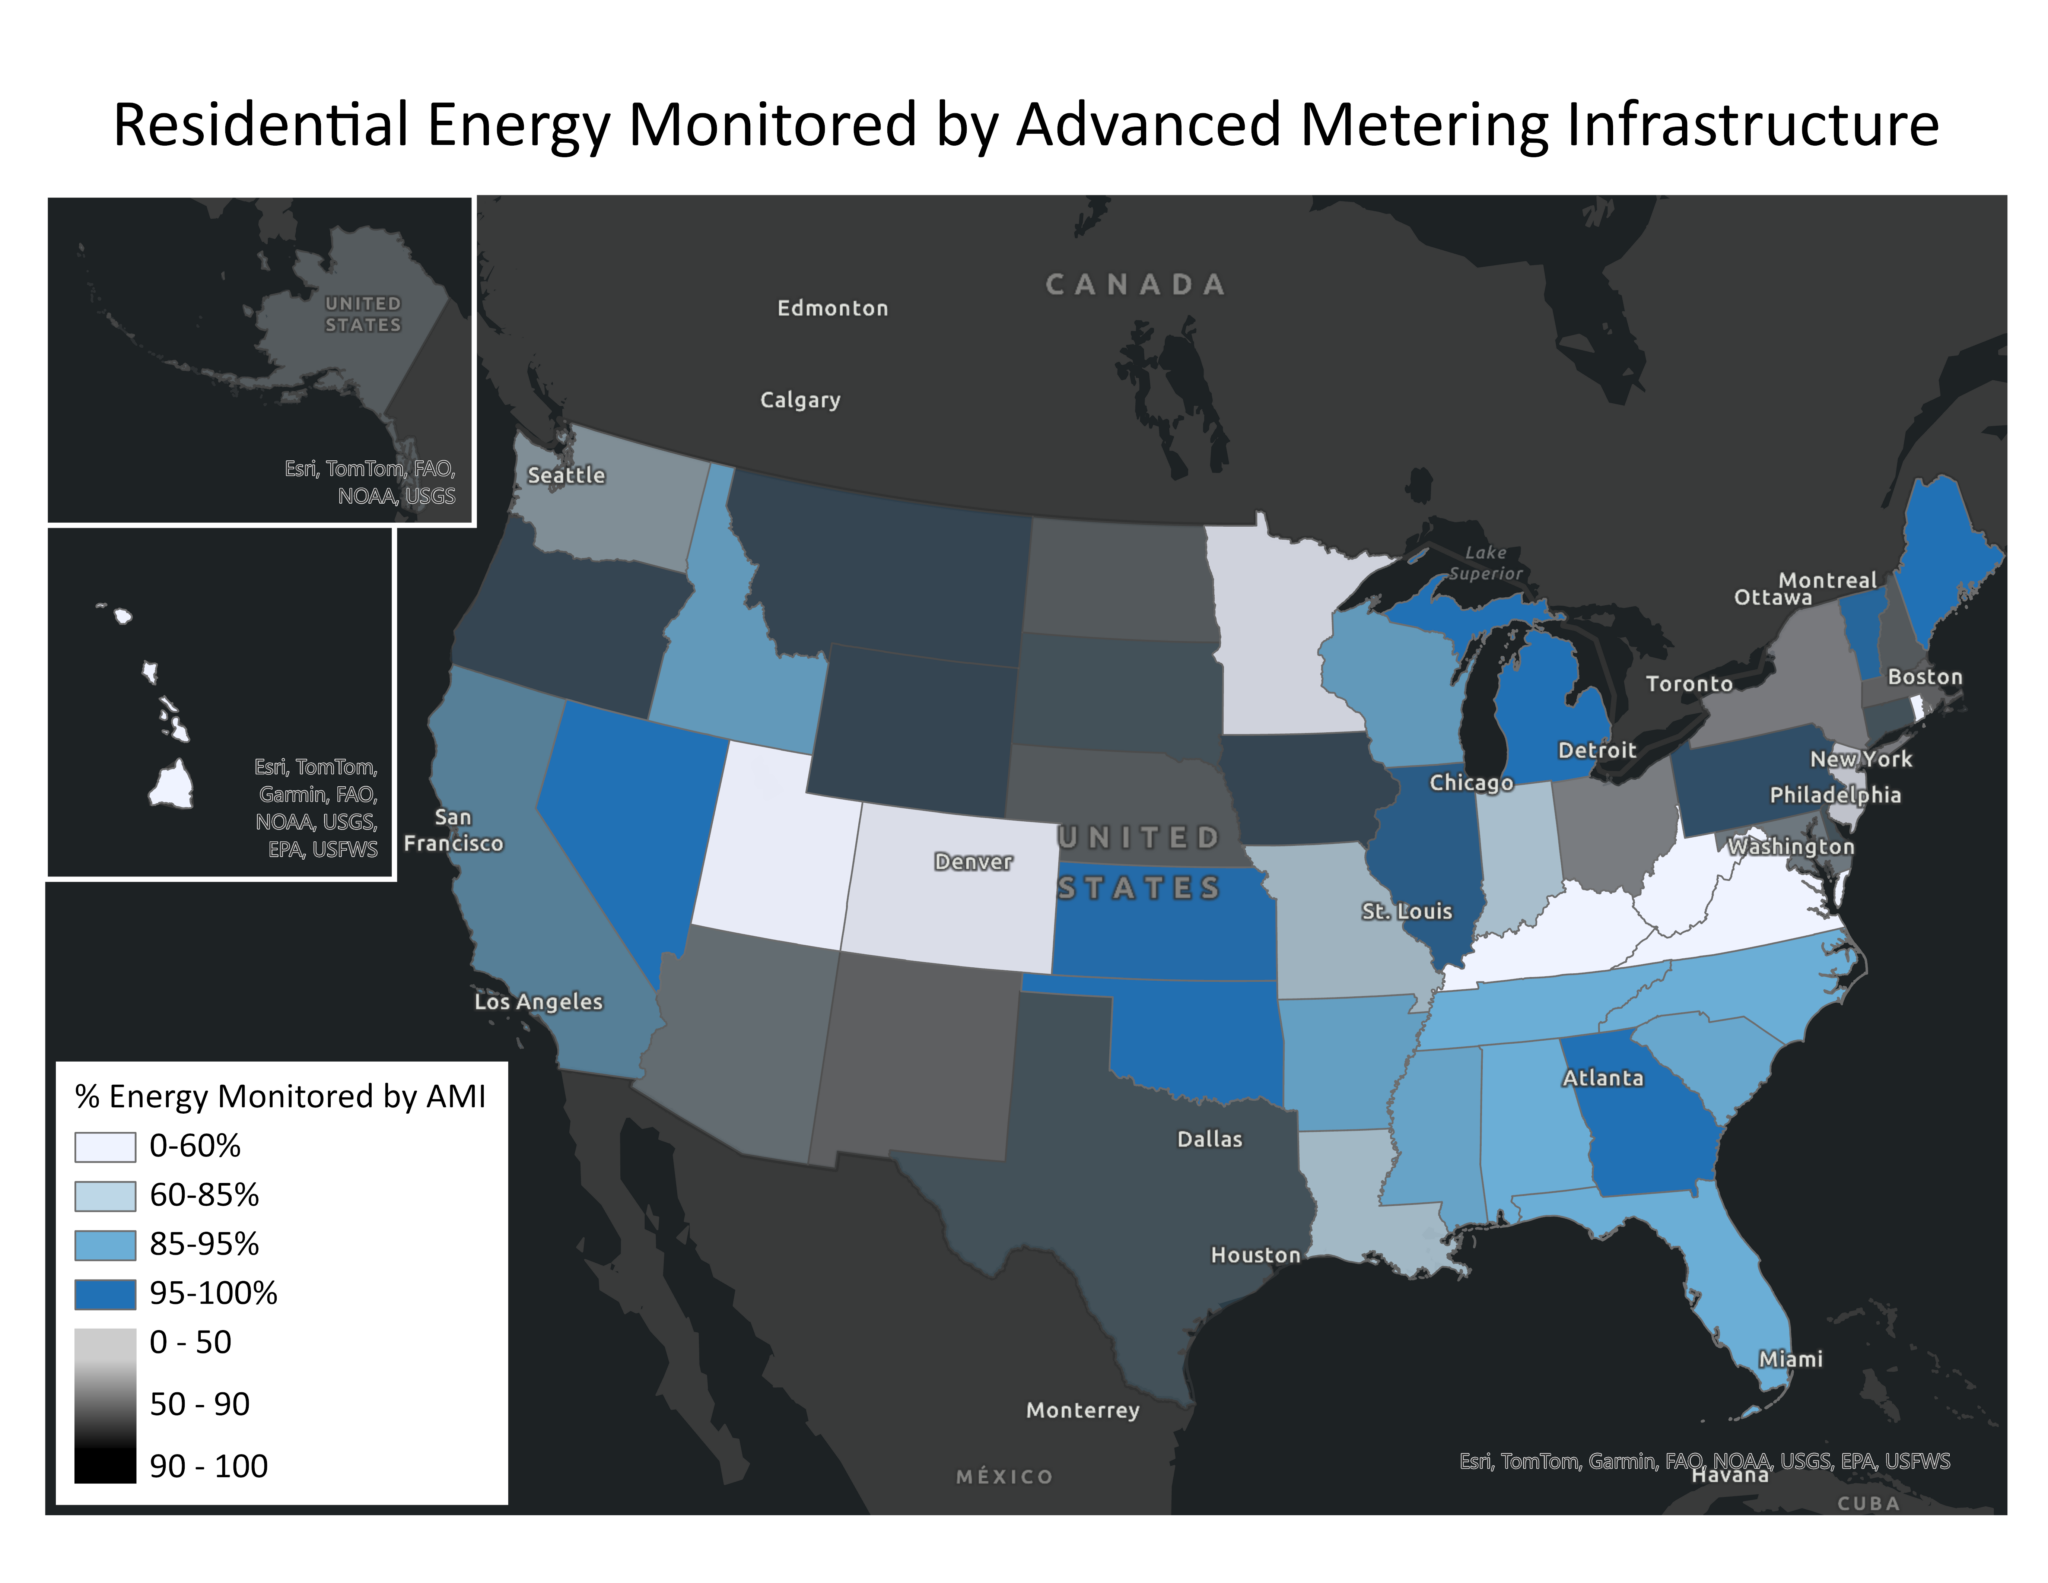
Accessing household energy data is critical to developing effective and evaluating efficiency programs, deploying energy assistance, and managing home energy use. Yet the accessibility of this data varies widely. One way to explore the accessibility of energy data is through Advanced Metering Infrastructure (AMI), a technology that monitors household energy usage, sends the encrypted data to the utility, and can communicate information back to the customer. A previous technology, Automated Meter Readings (AMR), allowed utilities to access real-time energy usage data but did not allow two-way communication with customers. The potential benefits of AMI include real-time energy adjustments by customers to lower bills, usage and outage notifications, and time-of-use pricing that encourages customers to shift energy use to times with lower energy prices. Because AMI provides granular data on energy usage, it can also be used to target and evaluate programs or policies for maximum impact and customer benefit.
This month’s map shows the percentage of residential energy sales (in MW) in each state that are monitored by AMI, as reported by electric utilities to the Energy Information Administration (EIA). The transparency of the map corresponds to how representative the data reported is of the state’s residential energy sales; states in which utilities report sufficient data for a high percentage of their energy sales appear opaque, while states in which utilities did not appear transparent. Both the percentage of energy tracked by AMI and the completeness of the data reported by utilities vary dramatically. The Southeast overall has a high rate of adoption with six states exceeding 90 percent of energy monitored by AMI, and the Southeast has some of the most complete data in the United States. In areas with low AMI adoption rates, its cost may be a barrier. AMI is more expensive than AMR, so ratepayers would first have to pay for the upgrade before realizing energy savings.
Even in areas that appear to have high adoption of AMI, there may still be barriers to accessing the data. A report by Mission: data national coalition of technology companies that works on energy data access—found that of the more than 17 million advanced meters funded by the American Recovery and Reinvestment Act in 2009, less than 3% have real-time data features enabled.
Some customers may even be unaware that they have AMI. According to the Residential Energy Consumption Survey, only 28% of households in the U.S. reported having an electricity “smart meter” in 2020, despite utilities reporting that about 65% of residential customers had one.
The data used in this map, which is reported unevenly to EIA and only covers around 70% of residential energy sales in the United States, underscores additional barriers to energy and data accessibility. As regulators and researchers continue to address data access issues, they must work with utilities to ensure the full benefits of AMI are realized and to understand the challenges to obtaining and reporting complete, high-quality data.
To this end, SEEA is launching a working group, as part of our Southeast Energy Insecurity Project (SEIP), to explore pathways to build data transparency around energy and housing data so that this data can be leveraged to address energy insecurity through policies and programs. If you, or your organization, are interested in digging into this issue as a member of a SEIP working group, please reach out to Will Bryan, SEEA’s Director of Research, at wbryan@seealliance.org.
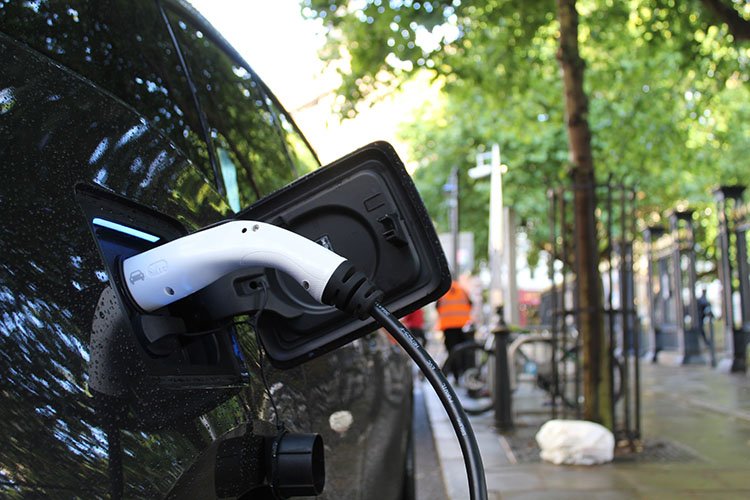
Growth of electric vehicle infrastructure offers hope for repair and renewal
Shrika Madivanan, Digital Communications Intern and Justin Brightharp, Senior Program Manager
Updated January 4, 2024
Pursuing equitable solutions starts with acknowledging the legacies of discrimination in in southeastern energy and transportation systems. In 2023, SEEA created three new StoryMaps that take a look at how energy security and equity impact transportation in Florida, Georgia, and South Carolina. We used data from federal and state sources alongside stakeholder feedback that tell a story about how transportation systems impact Black and brown communities and low- to moderate-income communities.
Each StoryMap utilizes unique data and stakeholder engagement, but share a common narrative that recognizes the unequal distribution of the benefits of clean transportation, community inclusion in decision-making, and burdens of emissions. They also provide policy recommendations that support an equitable transition to zero emission transportation. The StoryMaps are a resource for decision-makers and other stakeholders to identify which communities have experienced the most negative impacts from the transportation system and how to pursue federal and state funding opportunities that reduce transportation emissions, economically support communities and improve local public health.
SEEA is committed to acknowledging the influence of historic racism within the energy sector and related industries such as healthcare, insurance, housing finance and transportation. Racial segregation has always been a part of our country’s transportation systems and these historical inequalities still impact energy efficiency and transportation equity today. SEEA is developing a set of maps that illustrates how transportation infrastructure places additional burdens on people of color, and how zero emission public transit, fleets, and personal vehicles can address these issues.
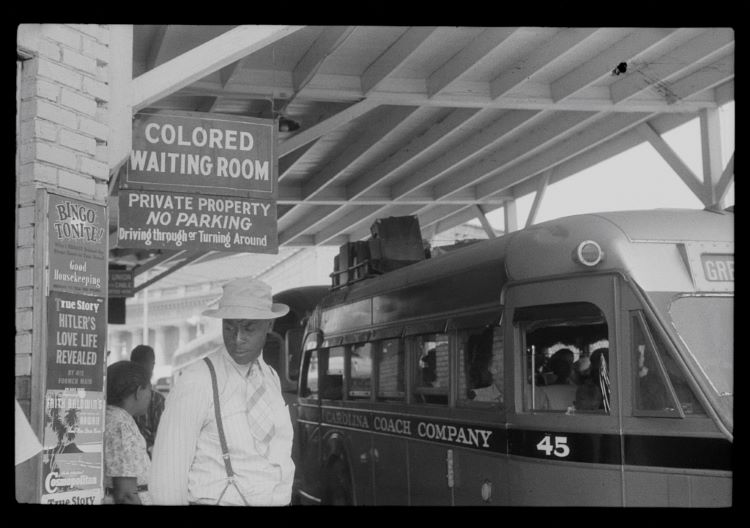
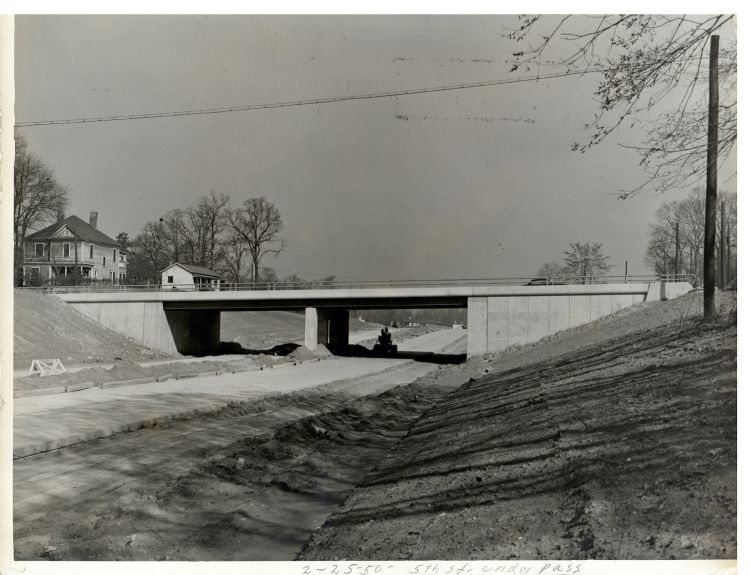
One of the most notable challenges in the system is an absence of charging systems in Black, Latino, low income and rural communities. The lack of accessible charging stations in minority communities today is the result of a long history of prioritizing white spaces. When Congress approved the Federal-Aid Highway Act of 1956, they intended to ensure “speedy, safe transcontinental travel,” but in doing so they also displaced many Black households. Many Black neighborhoods were demolished to build the interstate highway system, which amplified existing inequities like racial segregation and poverty. The destruction of these vibrant communities made accessing basic needs such as housing and access to clean air a burden for those who lived there.
Black residents who were not displaced experienced ongoing discrimination because the newly built highways cut off minority neighborhoods from economic opportunity. Often excluded from white neighborhoods, they were pushed to find new housing in communities already segregated by race and class. This put Black communities at an even greater disadvantage when looking for quality housing, employment opportunities and public services.
Public transit also has a history of racial inequality. When streetcars were first introduced, they initially created opportunities for people of color, making travel throughout cities more convenient. Still, segregation remained commonplace through mechanisms like separation screens and assigned seats. Though these explicit tools used to perpetuate racism have since been outlawed, access to public transit is still stratified by race.
Many public transit systems today are built on the foundation of two different consumers, “choice” and “dependent” riders. These terms mask descriptions of white and Black people, concealing biases toward white riders. This bias appears in transit system design. Systems are built under the assumption that “choice riders” need accommodations such as new rail lines and more accessible routes because they have a choice, whereas “dependent riders” receive the bare minimum as they have no room to be selective. Transit systems take extra steps to build schedules, route structure and infrastructure centered around white people. This bias extends to electric vehicles (EVs). The EV sector is growing quickly, aided by consumer interest and an influx of federal funding. This time of growth and transition provides an opportunity to build a better system and not repeat the mistakes of the past.
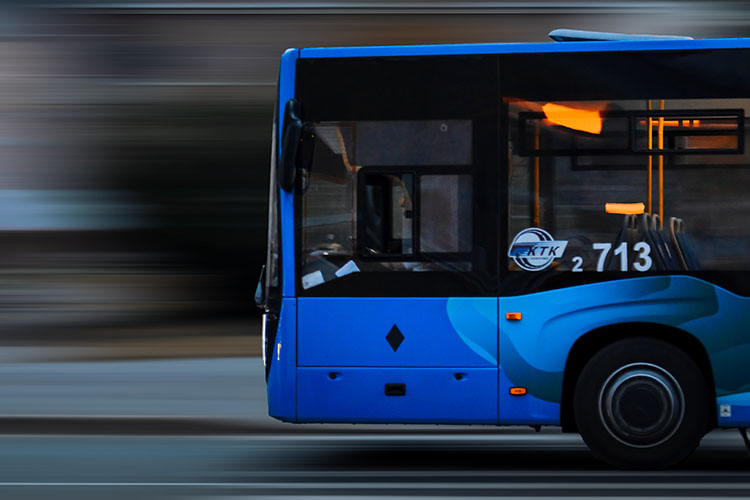
While improvement is still needed, public transit has reduced emissions and provides affordable, necessary services. The use of zero-emission buses is one example of the transit system making strides to be more sustainable and accessible. The Southeast has the second largest percentage of zero-emission buses in the nation, just behind the western states. The transit agencies that serve Lexington, KY, Chattanooga, TN, and Orlando, FL are regional leaders in low and zero emission buses. Last month, the City of Orlando released its 2030 Electric Mobility Roadmap outlining the city’s vision for cleaner, more equitable mobility opportunities from public transit to EV adoption to multimodal options.
Accessible, clean transportation creates opportunity and improves the quality of life for all. In addition to increasing the number of locations of charging systems, increasing the different types of charging systems ensures charging is easy to access and affordable. State and federal incentives like rebates reduce the upfront cost to purchase a new or used EVs, removing an additional barrier to adoption.
There are multiple obstacles that impact widespread EV adoption in minority and low income communities. Charging infrastructure is not widely available yet and it’s estimated that 80% of EV charging occurs at home and work. If a driver’s home or place of work does not have charging stations, they will need to install a charger at home, which increases upfront costs. Most Americans buy used vehicles as opposed to new vehicles. However, used electric vehicles are harder to find at most used car dealerships. Although the majority of people in the U.S. and Southeast drive personal vehicles, many people rely on other forms of transportation such as motorcycles, bikes, and public transit. Improving fleet electrification – the transition of light-duty vehicles, trucks, and delivery trucks to electric vehicles – is essential to expanding accessibility and provides additional options for clean transportation.
Transitioning to more low and zero emission vehicles is critical to Black, Latino and low income communities adjacent to interstate highways and travel corridors. Black and Latino communities are disproportionately affected by air pollution, and the lack of electric vehicles and charging stations within these communities contributes to emissions levels. From 1990-2019, a hike in demand for travel resulted in an increase in CO2, methane, and N2O emissions from buses by 162% and from medium and heavy-duty trucks by 92.9%. Medium and heavy-duty vehicles, including buses, account for less than 10% of vehicles on the road but contribute more than 60% of NOx and PM emissions.
Prioritizing building charging infrastructure in Black, Latino, low income and rural communities will make EV adoption easier, more affordable, and inclusive of all people living in the Southeast. Improving the accessibility of charging infrastructure will give way to new economic growth locally and regionally. EV drivers have longer dwell times, up to 45 minutes, at charging stations compared to gas stations. This extended break encourages time at nearby businesses like restaurants or shopping. In the Southeast, the EV manufacturing sector is expected to add thousands of jobs and billions in revenue to states and municipalities.
SEEA uses resources like StoryMaps to engage with regional and national decision makers on how to make the transition to low-and-zero carbon emissions vehicles more affordable and accessible and move towards a more just transportation system. We plan on publishing a new StoryMap focused on transportation and equity soon. If you have questions about this work, contact Senior Manager, Justin Brightharp.