Map of the Month – January

Grace Parker

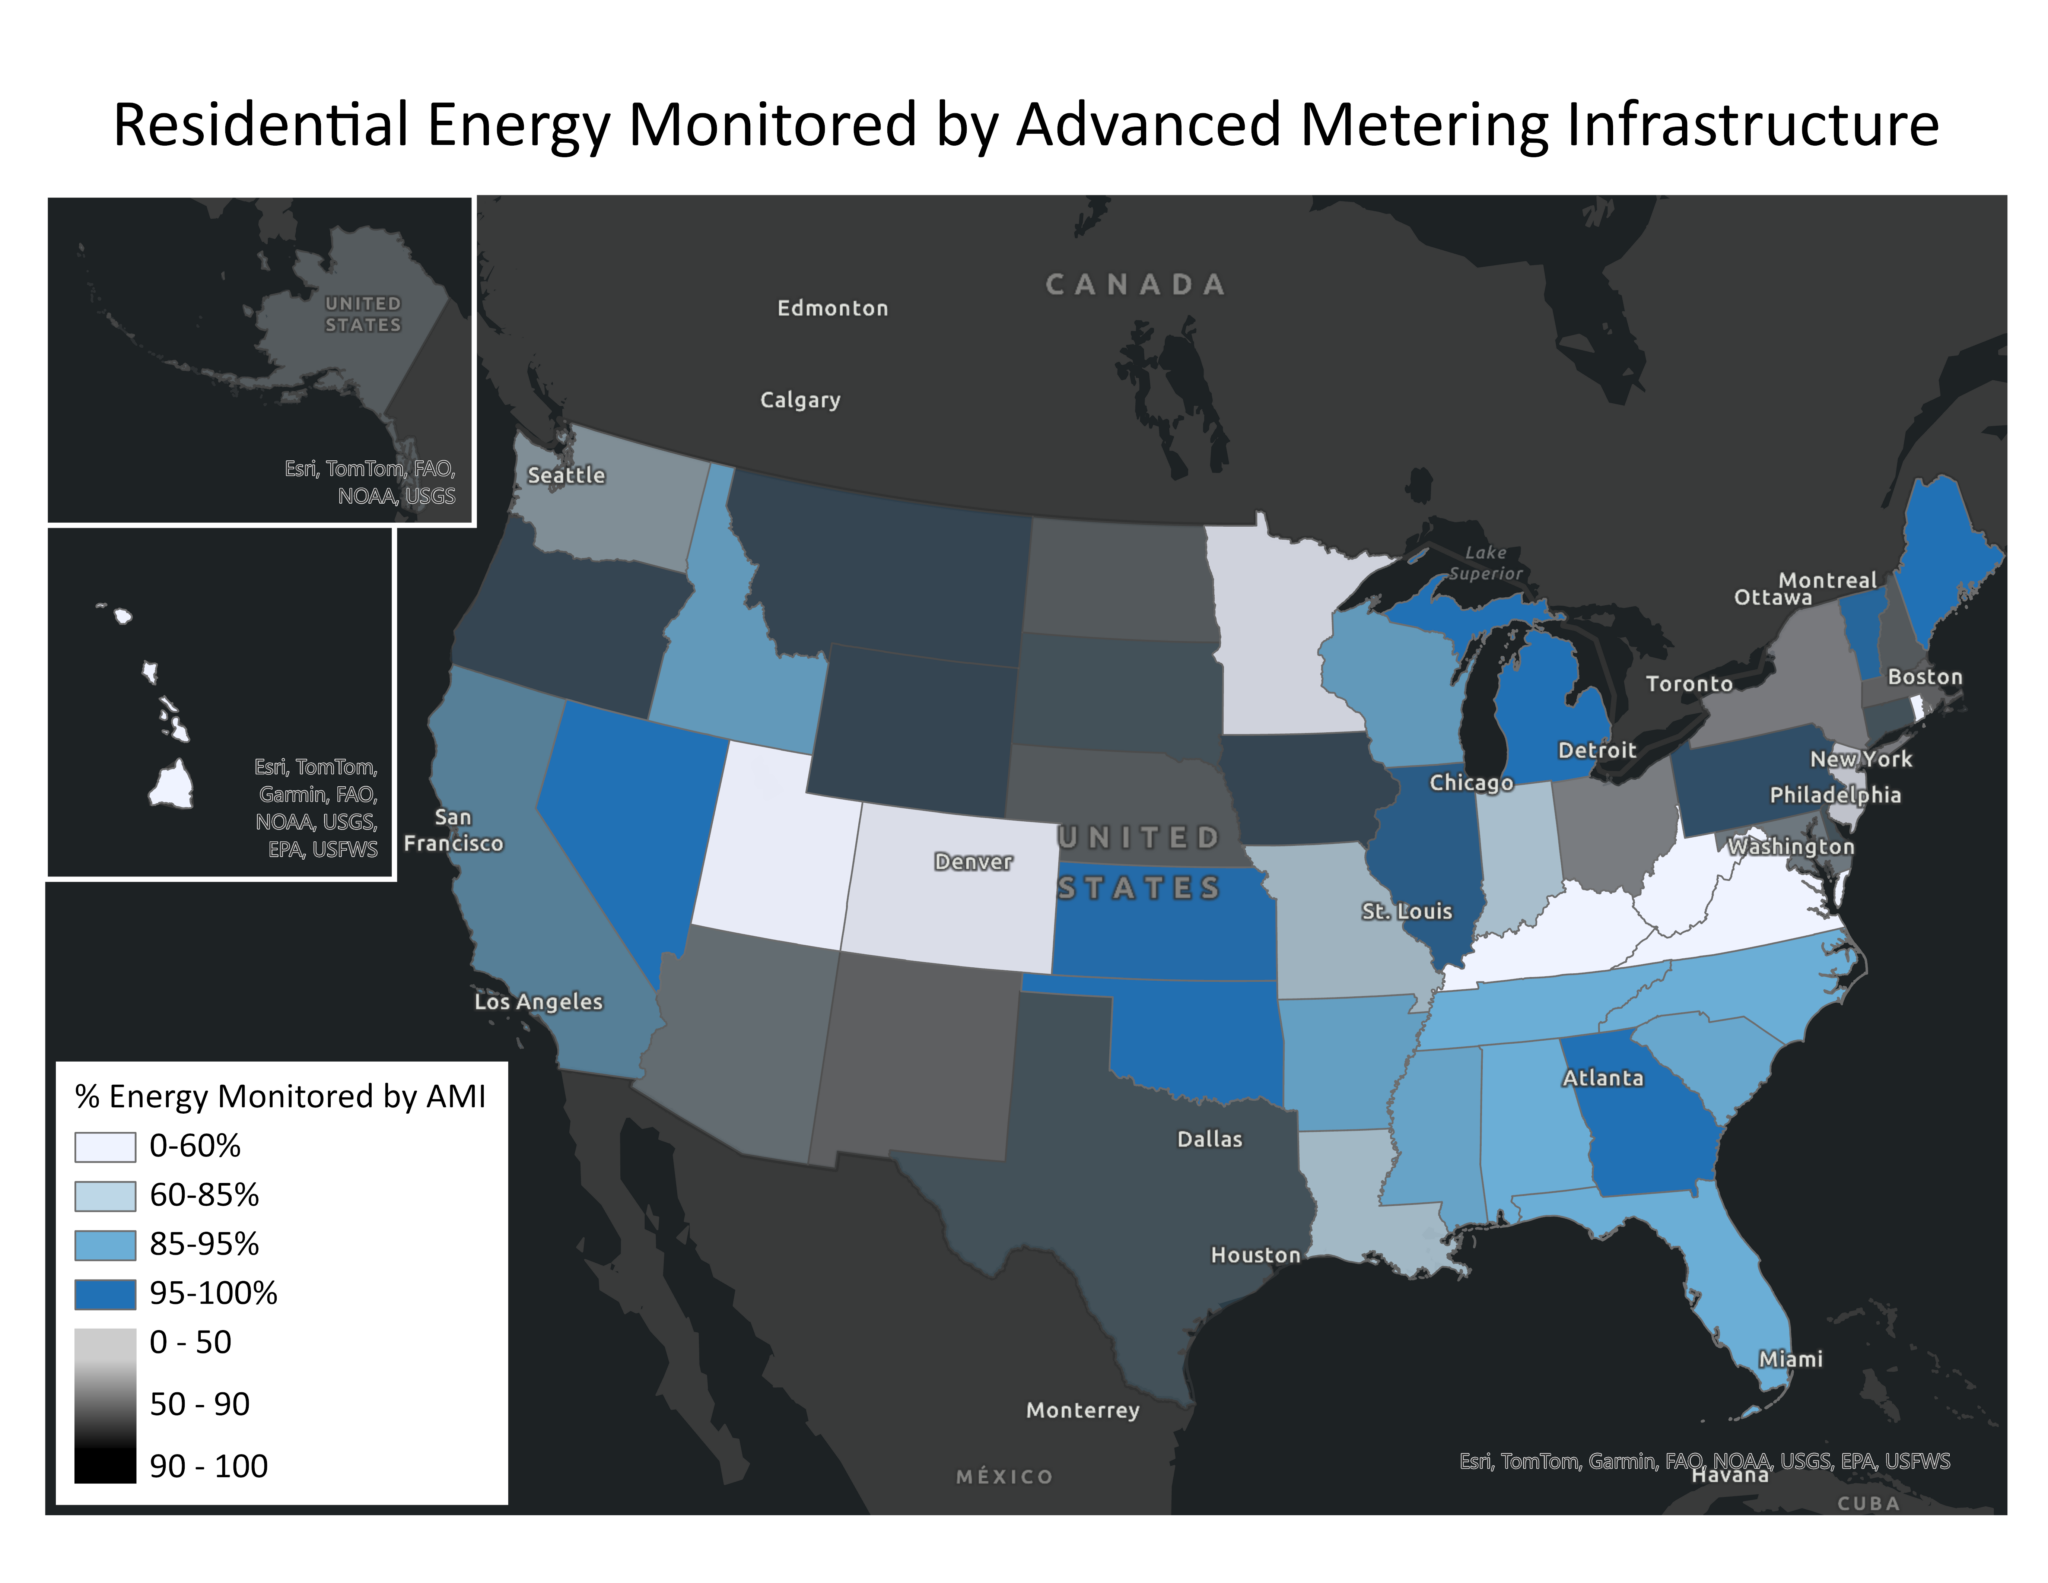
Data Source: EIA Annual Electric Power Industry Report Form EIA-861 Dataset; Graph: SEEA
Accessing household energy data is critical to developing effective and evaluating efficiency programs, deploying energy assistance, and managing home energy use. Yet the accessibility of this data varies widely. One way to explore the accessibility of energy data is through Advanced Metering Infrastructure (AMI), a technology that monitors household energy usage, sends the encrypted data to the utility, and can communicate information back to the customer. A previous technology, Automated Meter Readings (AMR), allowed utilities to access real-time energy usage data but did not allow two-way communication with customers. The potential benefits of AMI include real-time energy adjustments by customers to lower bills, usage and outage notifications, and time-of-use pricing that encourages customers to shift energy use to times with lower energy prices. Because AMI provides granular data on energy usage, it can also be used to target and evaluate programs or policies for maximum impact and customer benefit.
This month’s map shows the percentage of residential energy sales (in MW) in each state that are monitored by AMI, as reported by electric utilities to the Energy Information Administration (EIA). The transparency of the map corresponds to how representative the data reported is of the state’s residential energy sales; states in which utilities report sufficient data for a high percentage of their energy sales appear opaque, while states in which utilities did not appear transparent. Both the percentage of energy tracked by AMI and the completeness of the data reported by utilities vary dramatically. The Southeast overall has a high rate of adoption with six states exceeding 90 percent of energy monitored by AMI, and the Southeast has some of the most complete data in the United States. In areas with low AMI adoption rates, its cost may be a barrier. AMI is more expensive than AMR, so ratepayers would first have to pay for the upgrade before realizing energy savings.
Even in areas that appear to have high adoption of AMI, there may still be barriers to accessing the data. A report by Mission: data national coalition of technology companies that works on energy data access—found that of the more than 17 million advanced meters funded by the American Recovery and Reinvestment Act in 2009, less than 3% have real-time data features enabled.
Some customers may even be unaware that they have AMI. According to the Residential Energy Consumption Survey, only 28% of households in the U.S. reported having an electricity “smart meter” in 2020, despite utilities reporting that about 65% of residential customers had one.
The data used in this map, which is reported unevenly to EIA and only covers around 70% of residential energy sales in the United States, underscores additional barriers to energy and data accessibility. As regulators and researchers continue to address data access issues, they must work with utilities to ensure the full benefits of AMI are realized and to understand the challenges to obtaining and reporting complete, high-quality data.
To this end, SEEA is launching a working group, as part of our Southeast Energy Insecurity Project (SEIP), to explore pathways to build data transparency around energy and housing data so that this data can be leveraged to address energy insecurity through policies and programs. If you, or your organization, are interested in digging into this issue as a member of a SEIP working group, please reach out to Will Bryan, SEEA’s Director of Research, at [email protected].

