
Category: Equity
Room to Breathe: Lessons from Atlanta’s First Healthy Housing Program
By Laura Diaz-Villaquiran

SEEA is excited to share the results of the Room to Breathe pilot program that we led alongside the Atlanta Volunteer Lawyers Foundation (AVLF) and SK Collaborative. Room to Breathe, which ran from 2021 to 2023, was the first healthy housing program in the City of Atlanta to provide low-income renters with efficiency and healthy housing assessments. By helping renters access energy and health testing for their homes as well as legal aid services, this program facilitated health and safety upgrades and supported those at risk of eviction.
This program underscored the deeply interconnected nature of energy insecurity, housing insecurity, housing quality, health, and occupant safety. Diana Hernández has introduced the concept of energy insecurity, a framework that highlights how unaffordable energy costs and the inability to maintain essential energy services can force individuals to make difficult choices, such as sacrificing food and medicine.1 In this program, participating households were energy insecure, and tended to live in energy-inefficient homes, often under the looming threat of eviction—conditions strongly associated with negative health outcomes, including respiratory problems.
Recognizing these interconnected challenges, our pilot program was designed to address both housing quality and energy efficiency issues, with a focus on improving the affordability, health, and sustainability of housing. We believe this is a promising model for supporting low-income renters who face steep barriers to accessing assistance for home repairs and energy efficiency upgrades.
Program Model
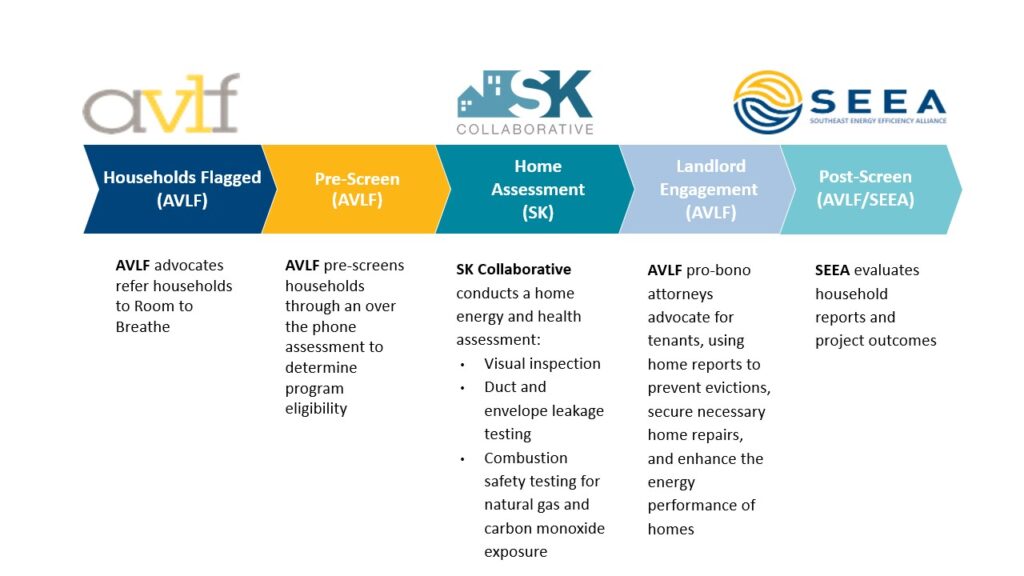
Figure 1. Room to Breathe program model. This model can be replicated without the large outlays of start-up capital required for most energy efficiency or healthy housing programs.
Renters who had reached out to AVLF for legal assistance were pre-screened through an over-the-phone questionnaire that evaluated if the household was a candidate for an in-depth home assessment. SK collaborative staff visited participating households where they evaluated the home’s indoor air quality and energy efficiency. Each assessment consisted of a thorough visual inspection, performance testing to quantify HVAC, duct, and envelope leakage, and combustion safety testing to examine the potential for exposure to natural gas and carbon monoxide. Reports of all findings were prepared by SK Collaborative and used by AVLF’s pro-bono attorneys to advocate for tenants’ needs. These reports were instrumental in halting impending evictions and securing home repairs for more than half of participating households.
Project Findings
A review of all 11 home assessments revealed patterns of inadequate housing conditions, potential health and safety hazards, and energy inefficiencies in participating homes.
The following were the most frequently reported issues, as indicated in Figure 2:
- All homes showed evidence of water damage, and SK Collaborative’s reports identified damage to the roofs, ceilings, floors, walls, and in some cases, foundations.
- 80% of homes exhibited damage to the building envelope, such as gaps, holes, and penetrations.
- 80% of homes had excessive dust, suspected microbial growth, and evidence of pests, such as roaches and rodents.
- Half of the homes had inadequate weatherstripping around doors and windows, leading to air leakage.
- 50% of homes had an air filter in poor condition at the central HVAC system.
- 30% of participating households had a missing air filter from the central HVAC system.
- 30% of households also reported that a child in the home suffered from respiratory issues.
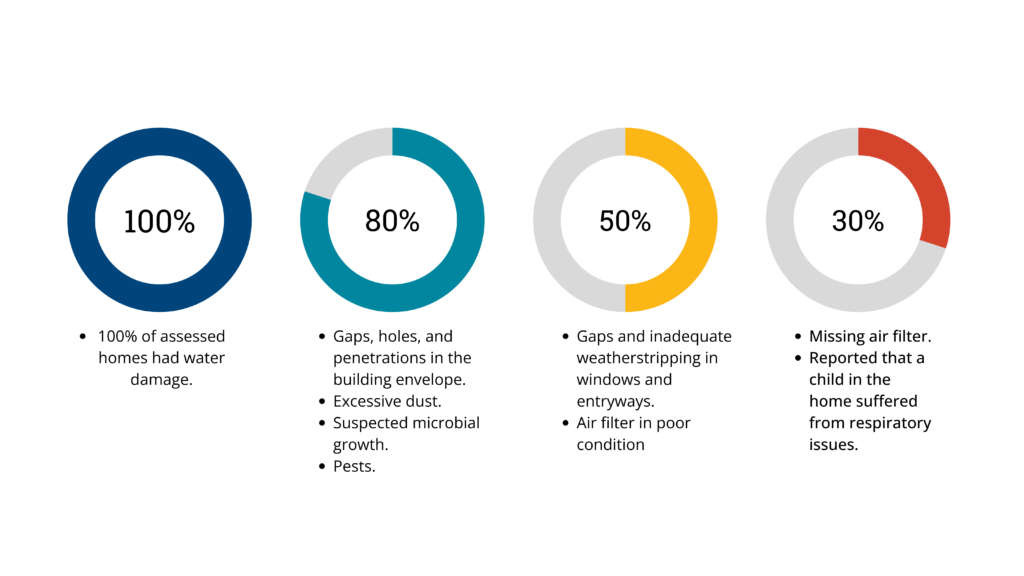
Figure 2. Home Assessment Results. This figure highlights the common housing quality challenges observed across participating households.
Lessons Learned and Future Work
Room to Breathe is a replicable and cost-effective model, developed through a collaborative effort between AVLF, SK Collaborative, and SEEA. Its success demonstrates that significant improvements in health and housing can be achieved without substantial upfront costs often needed in energy efficiency and healthy housing programs.
Our vision is to expand this model across the Southeast, increasing resilience for vulnerable households. By scaling up programs like Room to Breathe, we can enhance housing affordability, improve energy efficiency, and reduce negative health outcomes, driving meaningful change in both housing quality and public health.
Follow this link to read the full report
About SEEA:
The Southeast Energy Efficiency Alliance (SEEA) is a nonprofit organization committed to advancing energy efficiency in the Southeast to create a cleaner, more resilient, and equitable energy future. By fostering collaboration among diverse stakeholders and providing technical expertise, SEEA drives impactful energy efficiency initiatives across the region.
About SK Collaborative:
SK Collaborative provides practical, cost-effective solutions to meet building certification standards for developers, builders, contractors, architects, and homeowners. Their services include consulting, design reviews, training, building certification, and inspections to enhance efficiency, health, and durability in projects. With over 25,000 single and multifamily units certified under green building programs across the U.S. and internationally, they bring extensive expertise to both affordable and market-rate housing.
About AVLF:
The Atlanta Volunteer Lawyers Foundation (AVLF) is a nonprofit organization dedicated to providing pro bono legal support for low-income Atlantans. As the largest provider of free legal services in Atlanta, AVLF empowers clients to secure safe housing, fair wages, and freedom from intimate partner abuse. Each year, AVLF and its network of over 500 volunteers serve more than 5,000 people facing critical legal challenges. AVLF offers support through court representation, downtown legal clinics, offices in the Fulton County Courthouse, and outreach in schools and client homes, meeting clients wherever they need assistance and guiding them toward stability and justice.
For media inquiries to SEEA contact Jamie Kline and William D. Bryan, Ph. D
Disclaimer: The content in this article is intended for informational purposes
1 Hernández, Diana. “Understanding ‘energy insecurity’ and why it matters to health.” Social science & medicine 167 (2016): 1-10.
October Map of the Month
By William D. Bryan, Ph.D.
On July 1, 2024, Georgia’s Safe at Home Act went into effect. Passed earlier this year, the law establishes that for any lease signed after July 1 Georgia landlords have a “duty of habitability” and must ensure that their rental unit is “fit for human habitation.” This includes maintaining a safe and healthy property and addressing tenants’ maintenance requests in a timely manner, and it gives tenants legal recourse if these conditions are not met.
The Safe at Home Act is a critical step forward, but significant housing quality challenges remain for renters throughout Georgia and the South. A 2022 investigatory series by The Atlanta Journal Constitution underscored that thousands of renters in metro Atlanta face severe housing quality shortfalls and have little bargaining power, particularly with absentee landlords. Deferred maintenance has led to mold, pest infestations, and thermal discomfort that exacerbates health issues like asthma and can be a financial drain for tenants.
While Georgia’s new law provides a pathway to address deferred maintenance, millions of renters in the Southeast still struggle to get their landlords to make critical repairs. Deferred maintenance not only contributes to health struggles, but also undermines housing and community stability by forcing renters to search for better housing. In this way, deferred maintenance can force “involuntary moves” or displacement. While tenants may choose to leave poor housing conditions, this only underscores the lack of formal options for many tenants trying to get maintenance needs and other issues addressed.
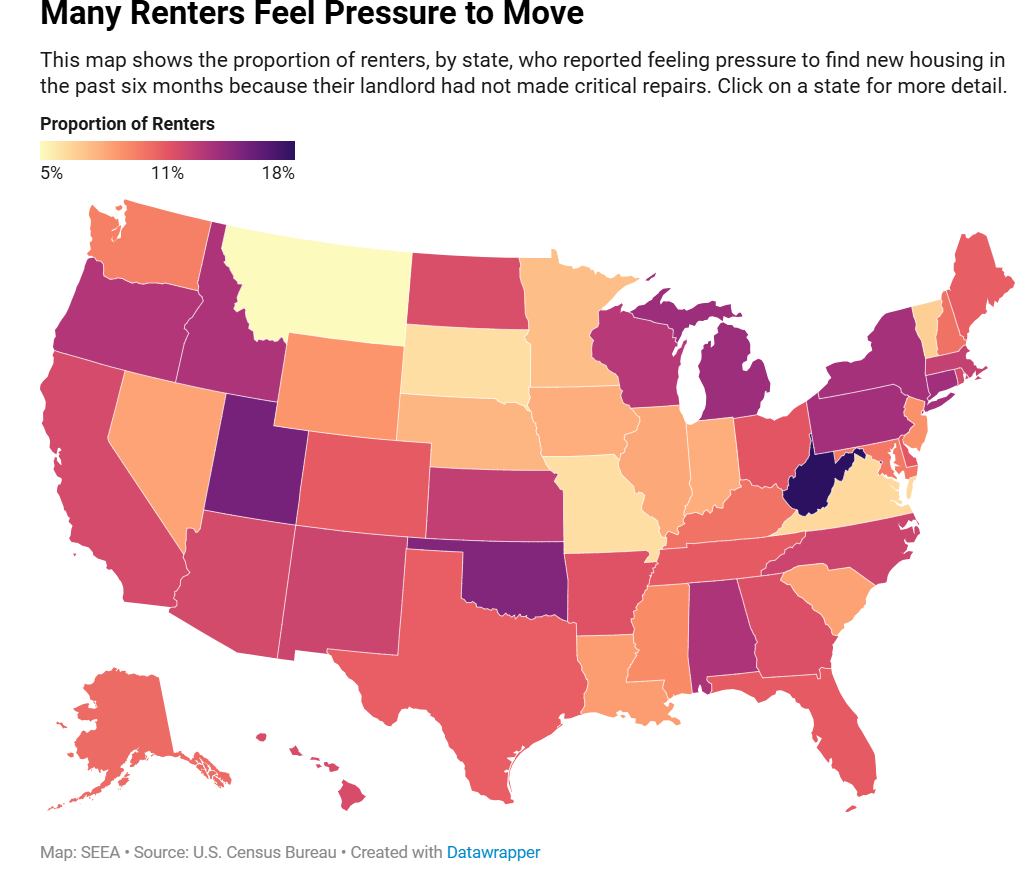
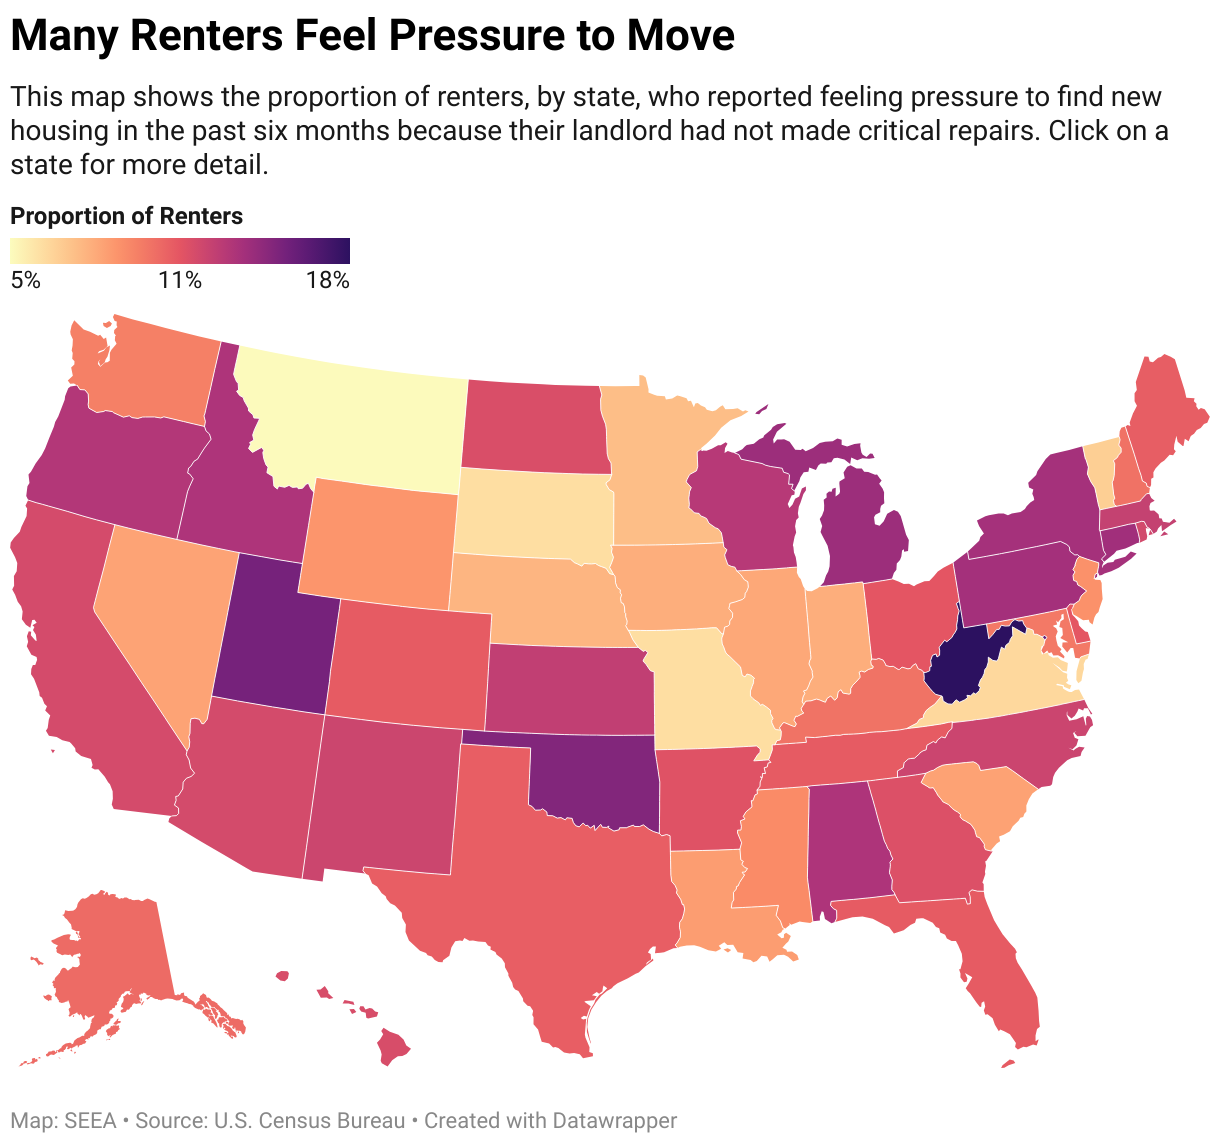
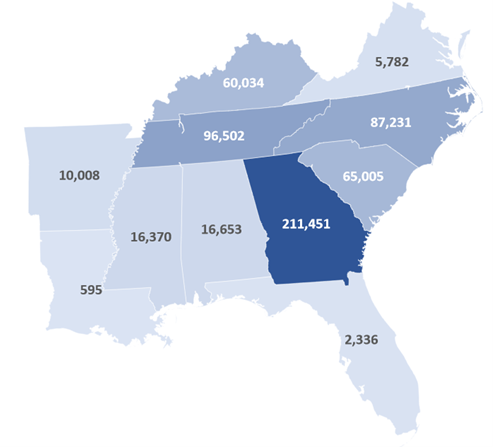
This month’s map uses data from the U.S. Census Bureau’s Household Pulse Survey, administered nationally in August and September of 2024, to show the proportion of renters in each state who reported feeling pressure to move in the past six months because of unresolved repair issues with their housing.
The data make it clear that a significant number of renters face housing quality pressures that contribute to housing instability. More than half (52%) of all renters in the United States have felt pressure to move in the last six months, with 11% attributing this to a lack of critical repairs. Other factors forcing tenants to consider a move include increases in rent (19%), a missed rent payment (4%), threats of eviction from a landlord (3%), living in an unsafe neighborhood (5%), or because a landlord has changed the locks or removed tenants’ possessions from a unit (0.2%). Nationally, these issues have an outsized impact on low- and moderate-income renters as well as Hispanic renters, who are most likely to feel pressure to move due to housing conditions.
More than 9 million renters in the South report feeling pressure to move, with nearly 2 million households in the region struggling with deferred maintenance. Even in Virginia, which is generally below the national average, 41% of renters have felt pressure to move in the last six months, driven primarily by sharp increases in rents. In West Virginia, 53% of renters have felt pressure to move and nearly 18% attribute this to unresolved repairs to their housing – the highest rate in the entire nation.
Housing quality and energy efficiency are closely linked, and energy efficiency programs can provide a key source of funding to address deferred maintenance and health issues. Although the “split incentive” between renters and owners makes it difficult for renters to access energy efficiency, there are proven models that can ensure renters are able to access the benefits of energy efficiency and clean energy and to address housing quality shortfalls. Tariffed on bill programs provide capital for home upgrades with repayments provided by the energy savings from upgrades performed. Because these programs are tied to the electric meter, not to an individual, they are available for renters or owners. Atlanta Housing is working with the Solar and Energy Loan Fund (SELF) to provide unsecured loans up to $25,000 to eligible landlords for energy efficiency and clean energy upgrades, paired with a rent boost up to $175 per month to offset loan payments. SEEA’s Room to Breathe program – a partnership with the Atlanta Volunteer Lawyers’ Foundation (AVLF) and SK Collaborative – also provides a model for innovative partnerships that can support tenants in addressing deferred maintenance and securing healthy housing.
Each of these provides key opportunities for leveraging energy efficiency funding to support the millions of renters in the South who struggle with housing insecurity by addressing deferred maintenance. But housing instability is multifaceted, and to address it at scale resources for tenants and landlords must be combined with robust tenant protections.
July Map of the Month
By Grace Parker
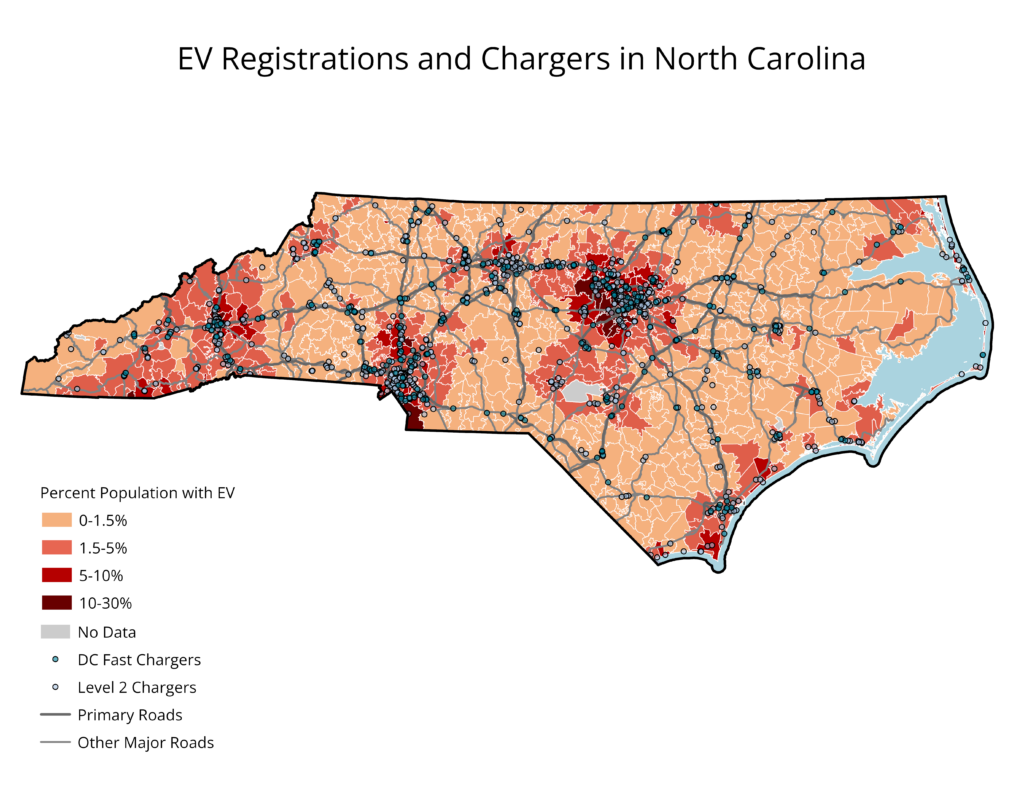
Source: Alternative Fuels Data Center and EV Hub
Historically, the development of transportation infrastructure in the United States has exacerbated inequities by displacing people of color and contributing to residential segregation. Without thoughtful approaches, the build-out of electric vehicle (EV) infrastructure has the potential to contribute to inequities through access and affordability disparities. The Bipartisan Infrastructure Law (BIL) provides funding to build 500,000 public EV chargers by 2030. Where these chargers are sited will play a key role in determining who can drive an EV and where air pollution is reduced.
In 2021, a MIT study reported that EV buyers were “mostly male, high-income, highly educated, homeowners, who have multiple vehicles in their household, and have access to charging at home.” The barriers to greater EV adoption are multidimensional, but expanded public charging access can make EVs a compelling option, particularly for renters and residents in multifamily housing who are unable to install charging equipment. Many stakeholders have a role in siting public EV chargers, including local governments, state transportation agencies, utilities, and private property owners, and all can play a role in making EV chargers more accessible.
Using data from the Alternative Fuels Data Center and Atlas Public Policy’s EV Hub, this month’s map shows that EV registrations are highly correlated with the number of public EV chargers. The roughly 1,650 public level 2 and fast charging stations in North Carolina and the areas of greatest EV adoption are both centered in the state’s most population-dense areas, including the Research Triangle, Charlotte, and the Piedmont Triad.
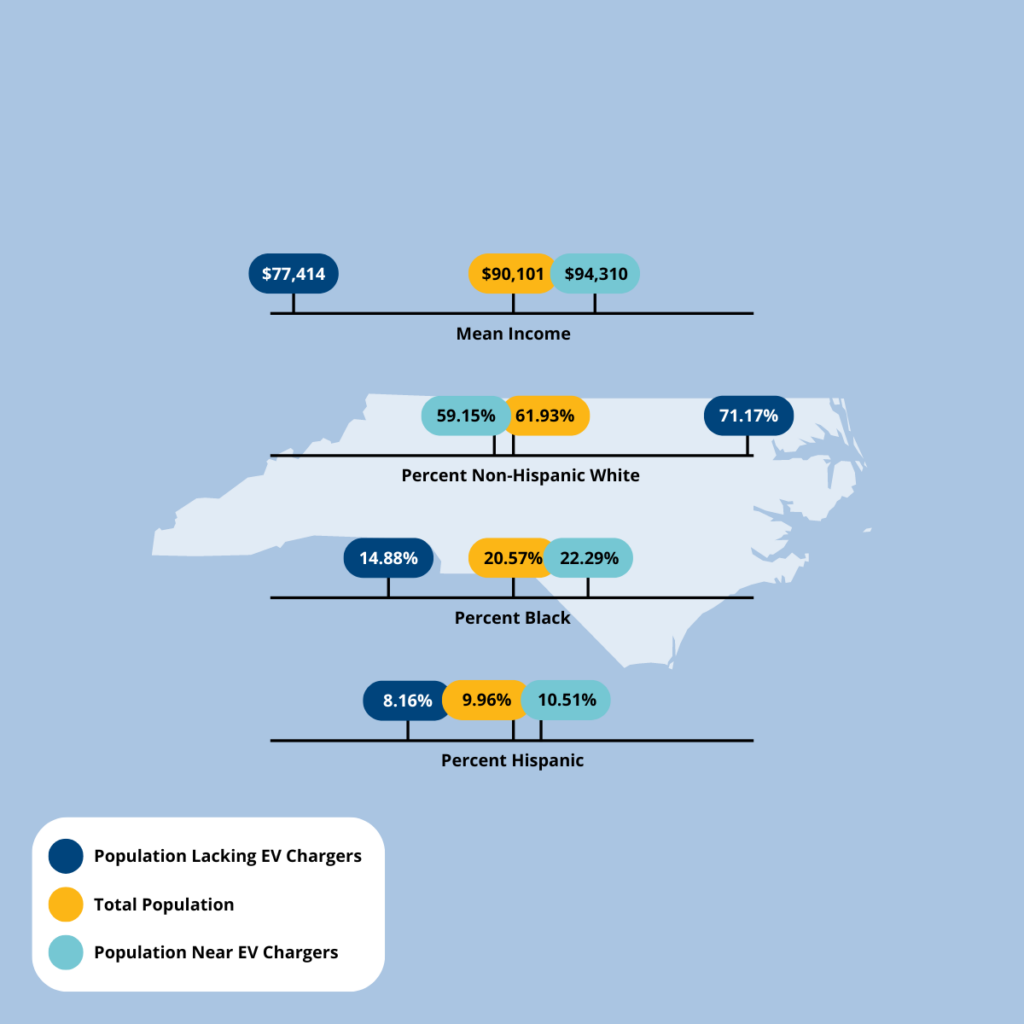
About 23% of the state’s population lives in a charging desert, which we define here as more than five miles from the nearest public charger. We found that this population had a significantly lower mean income of about $77,400 than the population overall at $90,100. While it is well-documented in other areas that people of color have less access to public chargers, at this scale we found that the population with charging access had higher proportions of Black and non-white Hispanic residents than the general population and those without charging access. This might be due to the urban-rural differences in racial composition, prioritization of equity in EV charger siting, or simply the geographic scale at which we did this analysis.
Many barriers to EV charging access cannot be captured by location, including the need for a smartphone or a subscription and associated costs such as expensive garages. Even where public charging is common, it can be 2-4 times more expensive than at-home charging, making it comparable to fuel costs for vehicles with internal combustion engines, and cutting into the fuel savings that make EVs a competitive purchase.
It’s crucial that, while building out public infrastructure, policies also prioritize at-home charging and EV purchase incentives. A variety of approaches have been implemented nationally to extend EV adoption to lower-income and multifamily building residents. Beginning January 1, 2024, the federal $7,500 tax credit was made available at the point of sale, extending it to lower-income households with less tax liability. Some states and utilities have set aside rebates specifically for multifamily property owners or low-income households. These policies help ensure that funding is directed to those for whom it is most impactful.
May Map of the Month
By: Grace Parker

Source by: American Community Survey
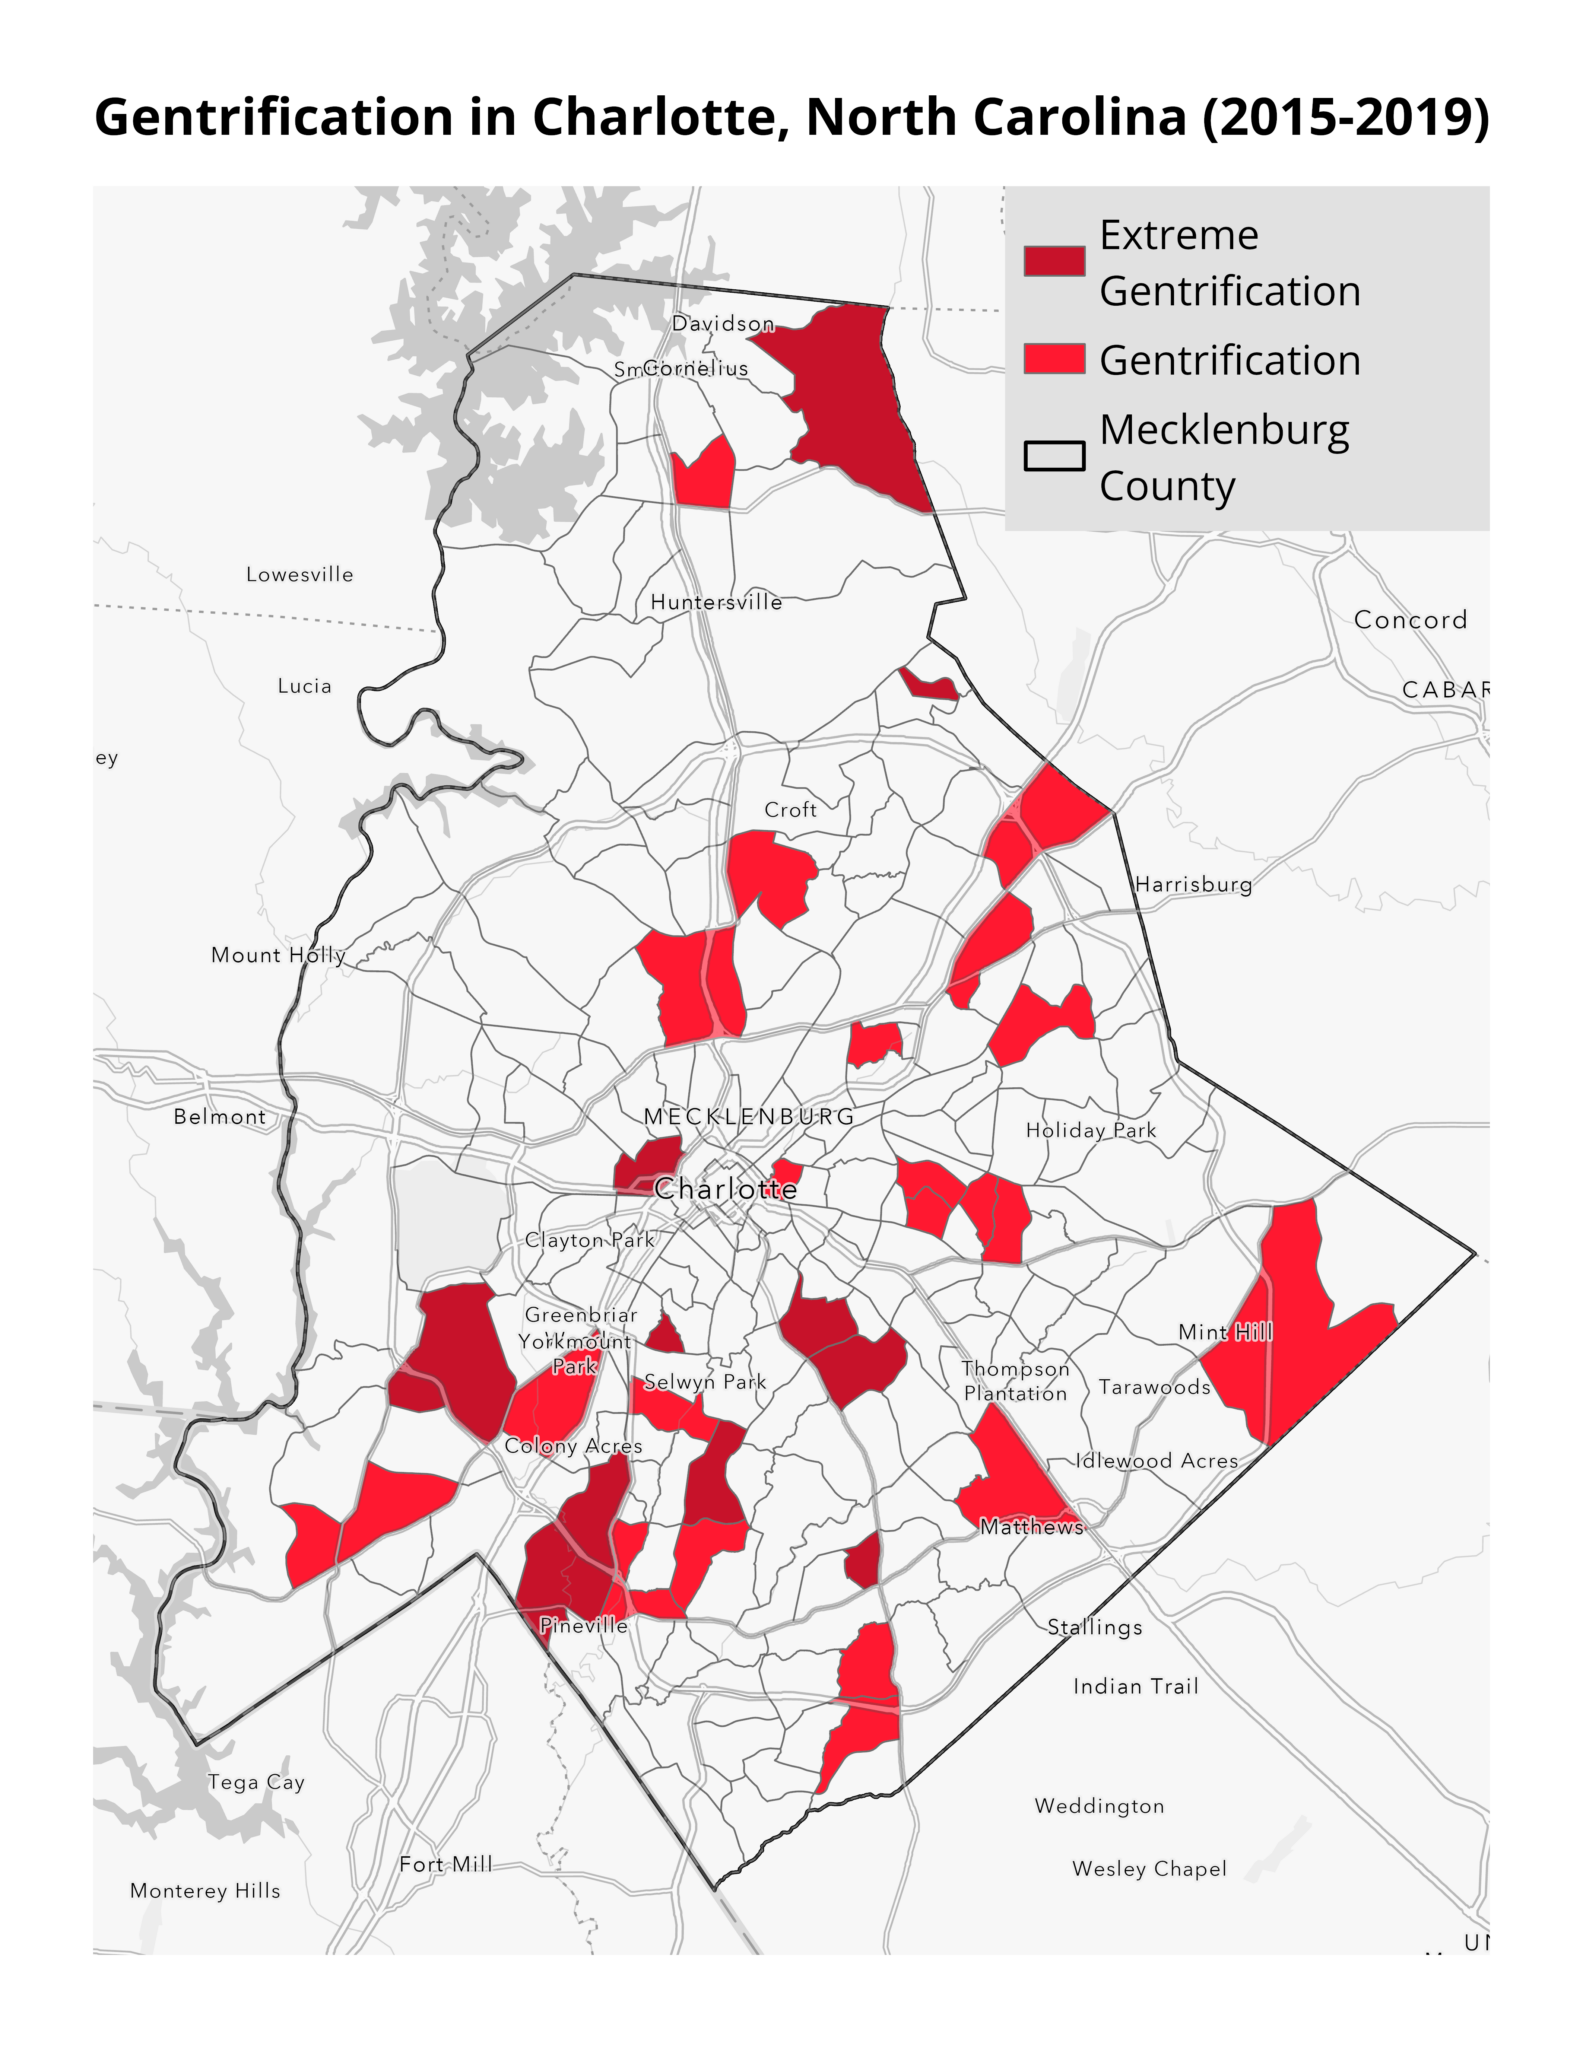
Unprecedented federal funding for underserved areas under the Justice 40 Initiative has the potential to mitigate the legacy of historical disinvestment in these communities. At the same time, new investments may contribute to gentrification if they fail to maintain the area’s affordability. Gentrification is the process by which lower-income households are displaced as their neighborhoods become less affordable—often due to rapidly rising rents or taxes —and it can be caused by the development of in-demand housing, businesses, and amenities. In many neighborhoods, this displacement disproportionately affects Black and Hispanic residents.
This month’s map highlights areas experiencing gentrification in Charlotte, North Carolina between 2015 and 2019. Our analysis finds that suburban communities in Charlotte have experienced the most rapid gentrification during this time. Areas like Davidson, Mint Hill, and Pineville have experienced sharp increases in the proportion of college-educated residents and in housing costs, for either renters or homeowners. In extremely gentrified tracts, on average, the proportion of college-educated residents increased by 9%, home values by 46%, and rental costs by 23% compared to 4%, 26%, and 18%, respectively, for lower-income tracts in general. It’s important to note that this method, created by Drexel University’s Urban Health Collaborative, of identifying gentrification does not take changes in racial composition into account, a component of other methods of identifying gentrification.
Gentrification is not unique to the South, but large Southern cities have experienced significant recent development that has put pressure on long-time residents. Our analysis focused on Charlotte as a case study of these booming Sunbelt cities that have been understudied, but other cities in the South—including Miami, New Orleans, and Nashville—are gentrifying even more rapidly.
Energy efficiency upgrades can help keep housing affordable by lowering energy costs and giving long-time residents savings that can be used to meet escalating housing costs. These measures are also important in enabling residents to pay for other necessities such as food and medicine and to prevent evictions.
Without careful design and execution, however, energy efficiency programs have the potential to increase the risk of gentrification by increasing rents and home values. This is sometimes called low-carbon gentrification.
Mechanisms to prevent low-carbon gentrification are critical and well-established. They can include agreements that prevent landlords from raising rents for a period after receiving energy efficiency upgrades. As Bipartisan Infrastructure Law and Inflation Reduction Act funding is invested in the Southeast, energy efficiency measures stand out as a mechanism to improve the quality of life in disinvested areas without displacing longstanding communities.
Re-Launching the “Energy Insecurity in the Southeast” StoryMap
ATLANTA, GA– SEEA proudly announces the re-launch of our acclaimed StoryMap, “Energy Insecurity in the Southeast.” Initially unveiled in 2021, this innovative digital resource delves into the complex issue of energy insecurity, which is prevalent in the Southeast. In this region, one in three households experience or have experienced energy insecurity, particularly low-income households and people of color.
The original StoryMap garnered attention and became SEEA’s most-viewed and cited resource, drawing the interest of decision-makers, community advocates, journalists, researchers, and others eager to address the causes of energy insecurity.
Aimee Skrzekut, SEEA President, reflects, “To increase awareness and to track Southeast progress, SEEA has thoroughly updated and refreshed the StoryMap. The new version includes a broader conceptual framework integrating the most recent data while offering insights into the roots of energy insecurity in the Southeast. The StoryMap also highlights the role of existing policies in perpetuating disparities in energy insecurity and housing quality while showcasing SEEA’s multi-faceted approach to addressing the challenge of Southeast energy insecurity.”
William D. Bryan, Ph.D., SEEA’s Director of Research, notes that the new StoryMap “underlines the intersectional nature of energy insecurity.” “By calling attention to the ways that energy, housing, and financial policies have contributed to disparities in who experiences the burdens of energy insecurity, we hope to show the necessity of multi-stakeholder solutions that reach beyond the energy sector to include partners in housing, public health, healthcare, insurance, and more. In this way, energy efficiency can provide pathways to reduce energy costs and improve the quality, healthfulness, and sustainability of housing while also facilitating community stability and wealth building.”
To explore the newly refreshed StoryMap and learn more about SEEA’s efforts to foster a more equitable, resilient, and inclusive energy-secure South, visit Energy Insecurity in the Southeast (arcgis.com).
For media inquiries, please contact:
William D. Bryan, Ph.D.
About SEEA:
The Southeast Energy Efficiency Alliance (SEEA) is a nonprofit organization committed to advancing energy efficiency in the Southeast to create a cleaner, more resilient, and equitable energy future. By fostering collaboration among diverse stakeholders and providing technical expertise, SEEA drives impactful energy efficiency initiatives across the region.
April Map of the Month
By: Laura Diaz-Villaquiran

Source: Union of Concerned Scientists, “Killer Heat in the United States” U.S. Census Bureau, Physical Housing Characteristics for Occupied Housing Units
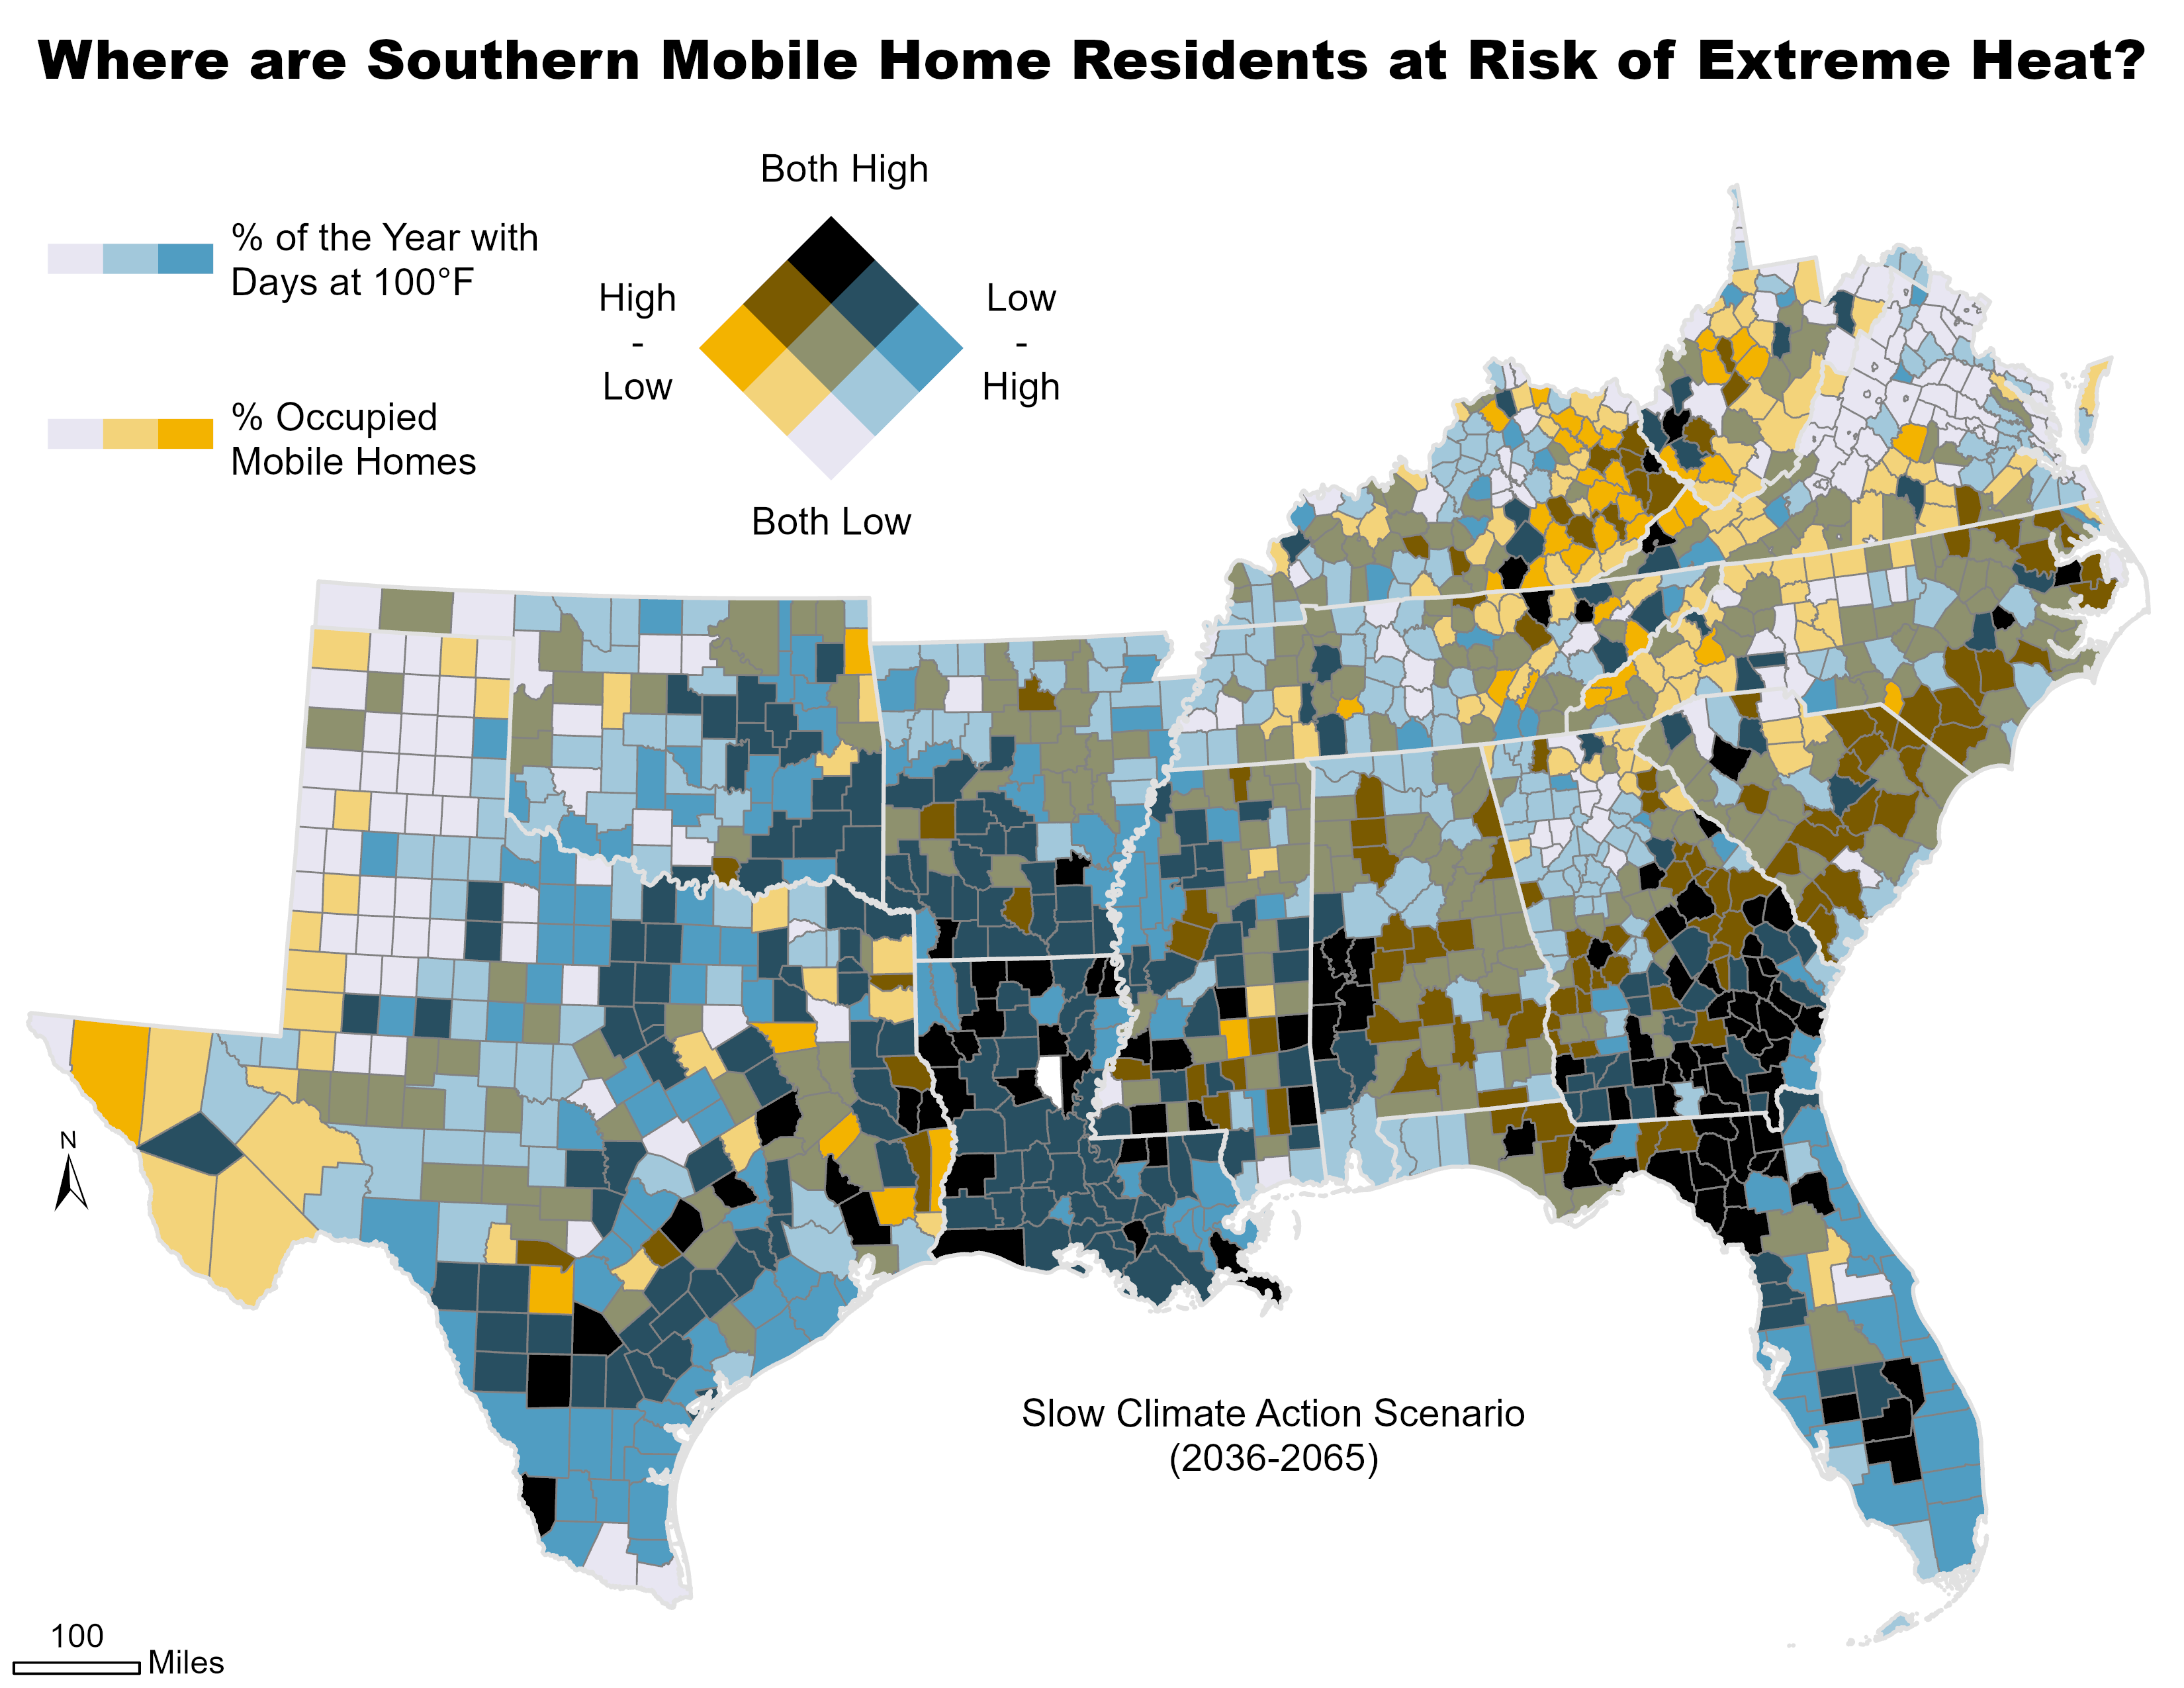
Extreme heat is the leading cause of weather-related death in the United States, and Southeast communities are particularly vulnerable to heat impacts as the climate warms. This vulnerability is not distributed evenly across the region, however. Research suggests that residents of mobile homes are among the most vulnerable to the impacts of extreme heat, with one 2021 study finding that mobile home residents are six to eight times more likely to die from heat-related illness than people who live in other types of housing.
The South has the nation’s largest share of mobile homes, and this month’s map considers where mobile home residents may be at the highest risk from expected increases in the prevalence of extreme heat by the middle of the century (2036-2065). Counties on the map shaded in dark blue have a high proportion of mobile homes—at least a quarter of the occupied housing units in those counties—and a high percentage of days with heat index values above 100°F. As the map indicates, these factors are overrepresented in counties in Florida, Texas, Louisiana, Georgia, Alabama, and Mississippi.
Research shows that people may experience elevated health risks —including respiratory and cardiovascular issues that can result in death—when exposed to temperatures of 80°F or more. Risks depend on a range of factors, including the length of exposure, physical activity, overall health, local environmental conditions, and how acclimated people are to those conditions. Outdoor workers, children, elderly people, those who are pregnant, and people with underlying health conditions are most susceptible. These risks can be magnified by housing quality and access to affordable energy. A report from the Union of Concerned Scientists notes, “When nights remain hot, health risks rise, especially for those without access to air-conditioning or for whom the choice of turning on the air-conditioning presents difficult financial trade-offs.”
These issues are often magnified in mobile homes, which, on average, have energy costs that are double those costs in stick-built homes. Recent estimates from the U.S. Census Bureau’s Household Pulse Survey indicate that 37% of people living in mobile homes, and earning less than $25,000 a year, kept their homes at an unsafe temperature to offset their cost-of-living expenses. Additionally, mobile home residents are more likely to face other “concentrated disadvantages” that include high energy burdens, lower-than-average incomes, a greater likelihood of living in rural areas that lack robust health and social services, and more.
Understanding future scenarios like this enables us to anticipate challenges for individuals residing in mobile homes while helping identify opportunities to leverage energy efficiency to mitigate heat-related illnesses and improve resiliency. These approaches could include home weatherization, implementing high-energy efficiency upgrades, and renewable energy retrofits. Additionally, targeted state and federal funding could prioritize communities that are most at risk of experiencing extreme heat in the coming decades.
National Emissions Standards: Unleashing Health & Economic Potential for the Southeast
By: Justin Brightharp
On March 20th and March 28th, the United States Environmental Protection Agency (U.S. EPA) finalized national emissions standards for passenger cars, medium-duty trucks and vans, and heavy-duty vehicles, respectively, applying to vehicle model years 2027 through 2032. These standards are expected to establish the United States as a leader in the clean transportation space, improve air quality, and lower fuel and operating costs for consumers.
Light-duty and Medium-duty Standard Projected Benefits
- CO2 reduced by 7.2 billion metric tons
- $13 billion in annual health benefits
- Particulate Matter reduced 8,700 tons by 2055
- NOx reduced 36,000 tons by 2055
- Volatile Organic Compounds reduced by 150,000 tons by 2055
- $46 billion in reduced annual fuel costs by 2055
- Almost $16 billion in reduced annual maintenance and repair costs
Heavy-duty Standard Projected Benefits
- 1 billion metric tons of greenhouse gas emissions avoided from 2027 to 2055
- Reduce air pollution for 72 million people near freight routes
- $13 billion in annualized benefits through 2055:
- $10 billion in climate benefits
- $300 million in benefits from PM reduction
- $3.5 billion in annual savings
Both standards are performance-based emissions, allowing flexibility in building gasoline vehicles with better engines and transmissions and increasing access to energy-efficient vehicle options like hybrid electric vehicles, plug-in hybrid electric vehicles, battery-electric vehicles, and hydrogen fuel cell vehicles. The southeast is home to billions of dollars in private investments from manufacturers along the electric vehicle supply chain, expecting tens of thousands of jobs. The transition towards transportation electrification will benefit the entire United States and local communities across the Southeast.
Projected Electric Vehicle Manufacturing Investments by State 2023
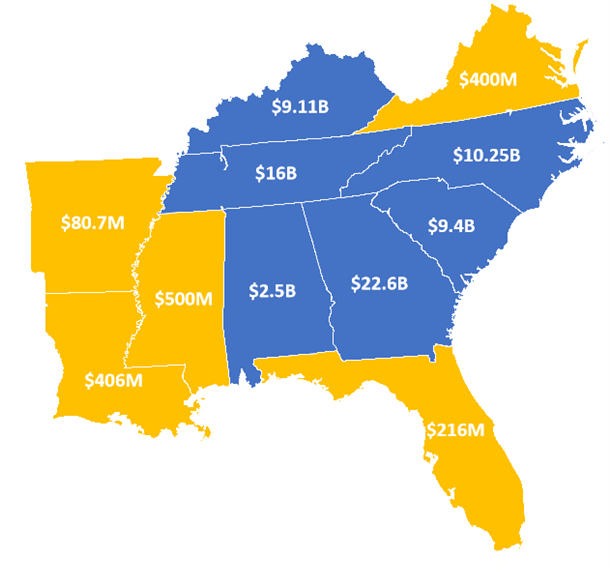
Map: SEEA. Data Source: Atlas Public Policy EV Hub Automaker Dashboard
Projected Electric Vehicle-Specific Jobs by State in the Southeast
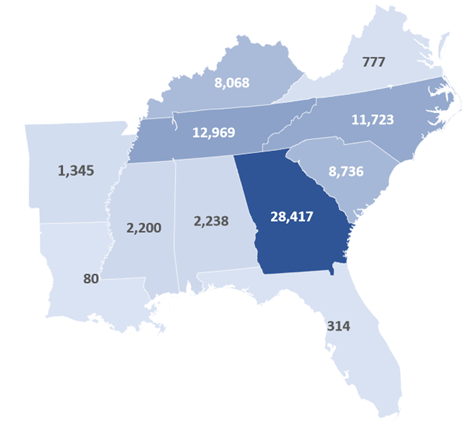
Map: SEEA. Data Source: Atlas Public Policy EV Hub Automaker Dashboard
Supporting electric vehicle production requires manufacturing batteries, building vehicle chassis and bodies, building and deploying charging stations, vehicle and charging station maintenance, and battery recycling, all of which can be found in the southeast region. The U.S. EPA projects that 67% of new light-duty vehicle sales and 46% of new medium-duty vehicles could be electric due to the new emissions standards. Thousands, if not millions, of electric vehicles sold in the United States and globally could be built in the southeast region with rippling effects.
For every 100 direct jobs in a durable manufacturing industry, like automotive, over 744 indirect jobs are created. Through 2025, the Southeast region’s existing and announced private investments are expected to bring $93 billion and almost 170,000 direct manufacturing jobs for electric vehicles. This could mean over 1.2 million additional jobs from suppliers and induced jobs from existing and future businesses, including small businesses.
Projected Indirect Jobs from Electric Vehicle Manufacturing in the Southeast 2023
Map: SEEA. Data Source: Economic Policy Institute Employment Multiplier Report. Jan. 2019
The national emission standards for light-duty and medium-duty vehicles, as well as heavy-duty vehicles, provide consumers with health benefits and cost savings and emphasize consumer choice. One of the pathways to improved air quality and health, as well as affordable electric vehicles, for the United States, runs through many communities in the Southeast. The Southeast is poised to see economic growth and the many health and cost benefits from both emissions standards through the thousands of manufacturing jobs created by the electric vehicle supply chain and over a million indirect jobs. Coupled with federal tax incentives: $7,500 for new light-duty electric vehicles, $4,000 for used electric vehicles, and $40,000 for new commercial medium- and heavy-duty electric vehicles built in the United States and the billions of dollars of public investment from the Bipartisan Infrastructure Law and Inflation Reduction Act, we can further accelerate towards cleaner air and better health in our communities.
March Map of the Month
By Grace Parker
Source: Federal Communications Commission
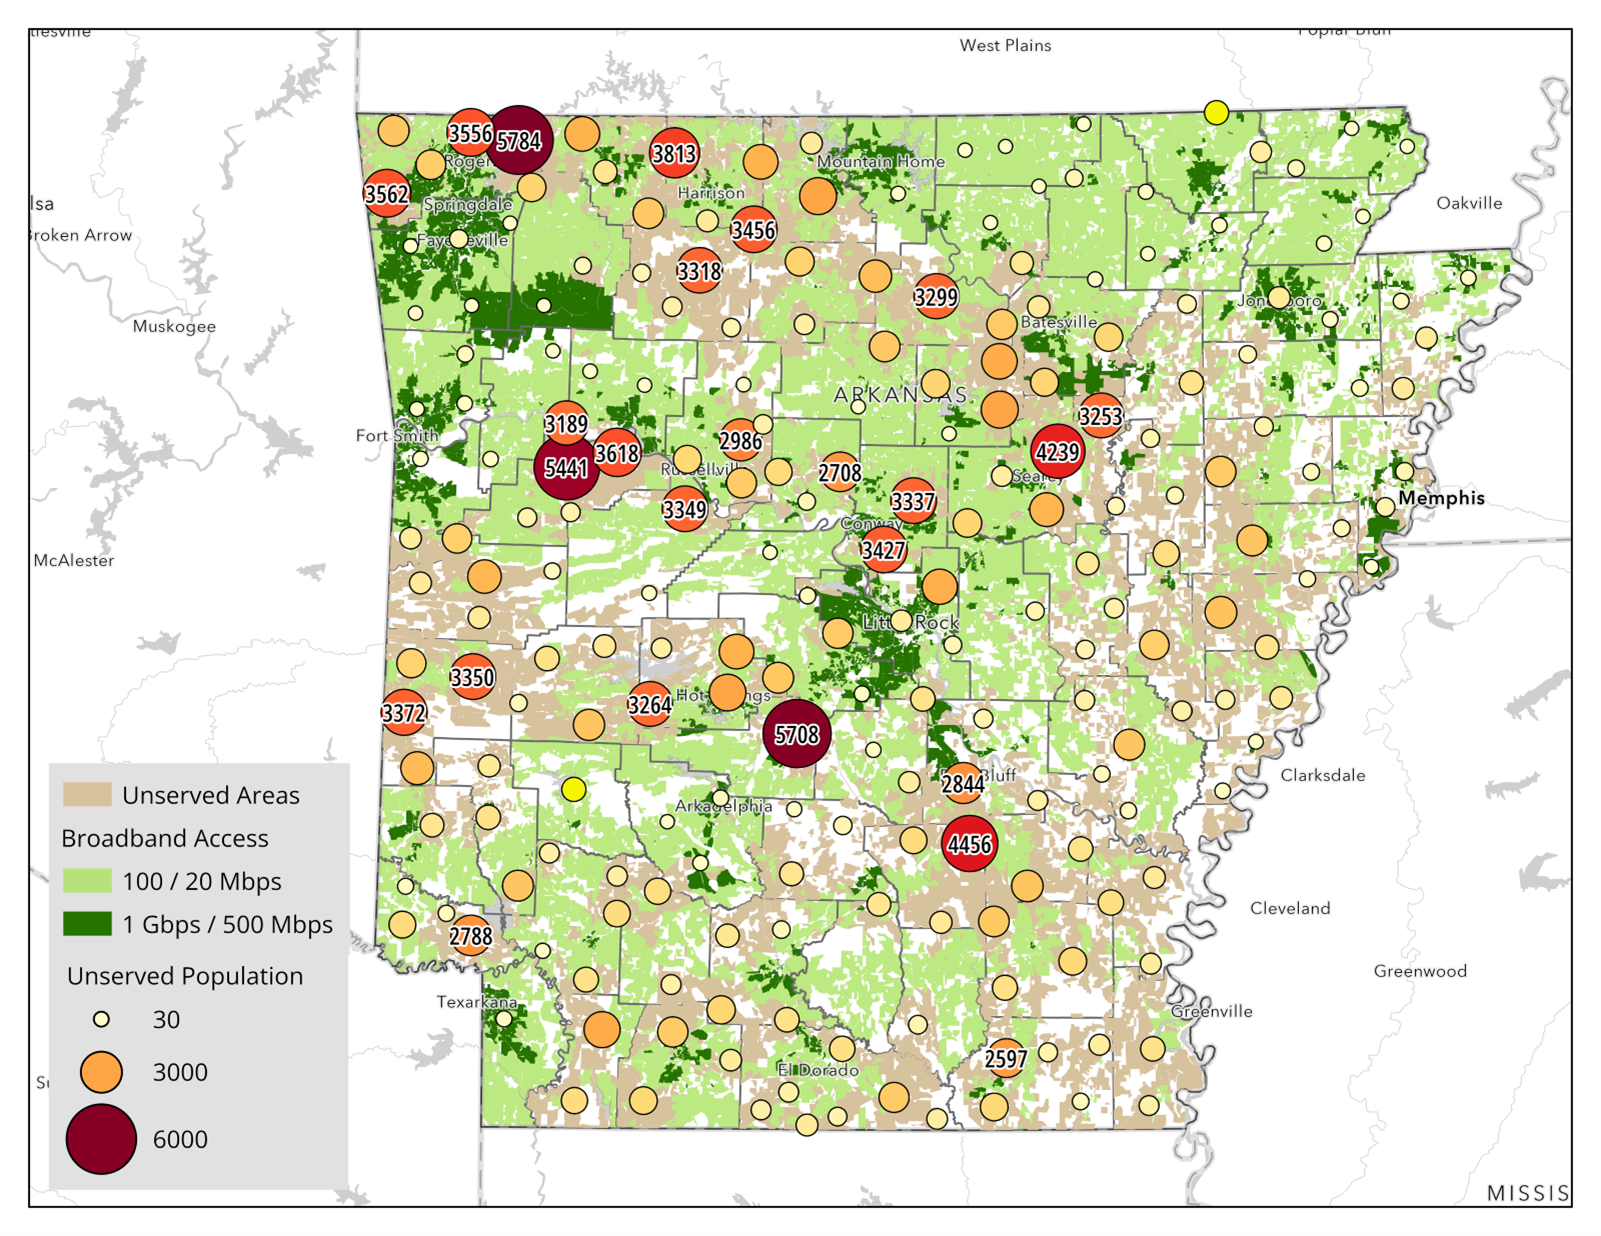
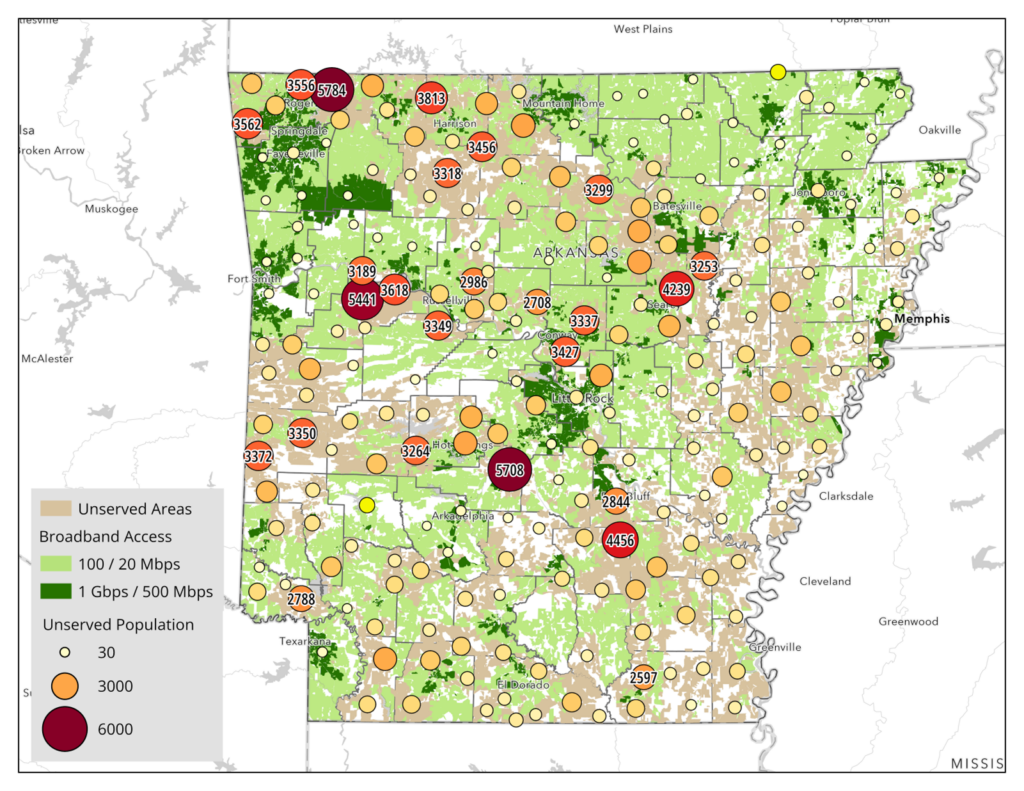
In today’s interconnected world, broadband is not a luxury; it is a necessity. Broadband influences many facets of life, from access to education to employment opportunities and even health. Access to broadband is also critical to monitoring and reducing residential energy use. Many energy technologies, such as smart thermostats and smart meters, require broadband connectivity to function, while most energy assistance programs rely on online applications for aid. Households that have limited access to broadband can find it more difficult to make use of energy efficiency assistance and have fewer tools to monitor and reduce home energy use.
Drawing on data from the Federal Communications Commission (FCC) this month’s map shows the population in Arkansas without high-speed broadband access. Arkansas has about 251,000 households who lack adequate broadband access. At 14.3% of the state’s households, it’s one of the highest rates in the United States. That number increases to 17.4% when you account for those who have access to broadband infrastructure but do not have a subscription, likely because of affordability challenges. This problem extends across the South, with a 2009 report finding that the South had the lowest rate of broadband use and the greatest urban-rural divide.
The FCC defines high-speed broadband as 100/20 megabits per second (Mbps), or 100 Mbps of download speed and 20 Mbps of upload speed. The FCC also set a nationwide goal of 1 Gbps/500 Mbps, which is currently only available in urban parts of Arkansas. This map likely underrepresents the population unserved by high-speed broadband since all the residents of a census block are considered served if anyone within it has access.
The map highlights the difficulty broadband providers face in reaching rural areas, showing how, across the state, there are small, dispersed groups lacking broadband that will require significant investments in infrastructure by providers. Meanwhile, there are larger groups in more populated areas that still lack broadband access, which are more likely to be economical investments for providers.
The lack of high-speed broadband and the energy efficiency measures it enables contribute to a concentrated disadvantage. Nationally, rural energy burdens are 40% higher than those in urban areas. Since most smart energy-saving devices communicate through the home’s broadband, these households have fewer opportunities to monitor and reduce their energy use. Energy assistance information and applications for programs such as the Weatherization Assistance Program (WAP) and utility offerings are often online, making it more challenging for these households to pursue energy efficiency upgrades.
The Department of Commerce is investing over $1 billion in Arkansas and $12.8 billion in the Southeast as part of the “Internet for All” initiative, but some stakeholders and experts have expressed skepticism that this will be sufficient for making broadband universal. Electricity-broadband partnerships are one way to make the funding go further. These partnerships are expanding broadband coverage in the Southeast by sharing infrastructure, making it more cost-effective for broadband providers to reach dispersed populations. These partnerships include investor-owned utilities like Entergy and Alabama Power and many electric cooperatives. Electricity access – which is nearly universal in the United States from an infrastructure standpoint – far outpaces that of broadband, in part due to the work of electric cooperatives created to expand service into rural areas. These intersectional partnerships will be crucial to reaching the rural Southeast.
Map of the Month – February
Laura Diaz-Villaquiran
Hover over the map to click through the slideshow. Click on image to view full image.
 Redlining and Tree Canopy in Memphis, Tennessee

")

Data Source: Mapping Inequality: Redlining in New Deal America Dataset; U.S. Forest Service Tree Canopy Cover (TCC) Dataset; Maps: SEEA.
Few things have impacted cities today as much as the suite of policies and practices that segregated neighborhoods on the basis of race over more than a century. Housing segregation had existed in practice for decades before the 1910s when white policymakers enacted the first racial zoning laws. Although these laws were declared unconstitutional by the United States Supreme Court in 1917, white city officials throughout the South still found ways to advance racial residential segregation.
In the 1920s and 1930s, segregation was taken up by the federal government in the form of “redlining,” the practice of denying financial lending – particularly for home purchases or improvements – to people based on their race or ethnicity and what neighborhood they lived in. For instance, the federal Home Owners’ Loan Corporation (HOLC) developed a series of maps that used the racial makeup of city neighborhoods to guide mortgage lending practices based on their assessment of the risk of lending. HOLC devised a four-tiered system that characterized neighborhoods in more than two hundred cities as A – best, B – still desirable, C – declining, and D – hazardous. These ratings were largely based on the racial makeup of a neighborhood, with C and D ratings typically having a larger share of racial and ethnic minorities than neighborhoods that rated A and B.
HOLC maps had less of an impact on private markets than often suggested, but they guided Federal Housing Administration (FHA) lending decisions for decades. Beyond that, they are also a spatial reflection of generations of policies and programs that segregated American cities, with far-reaching consequences that still shape cities today.
Using tree canopy cover data from the U.S. Forest Service, this month’s map explores the relationship between redlining and urban tree canopy. In three cities (Columbia, Jackson, and Memphis), we find that formerly redlined neighborhoods have about half the level of tree canopy today than historically white neighborhoods.
In Memphis, Tennessee, formerly redlined neighborhoods have an average tree canopy covering 20% of the neighborhood, while neighborhoods rated “A” have canopies that cover about 43% of their land area. In Jackson, Mississippi, formerly redlined neighborhoods had an average tree canopy of 24%, while neighborhoods rated “A” have 50% canopy cover. In Columbia, South Carolina, formerly redlined neighborhoods had 15% tree canopy, compared to 32% for non-redlined neighborhoods.
These findings are consistent with national studies, which demonstrate how the legacies of residential segregation continue to impact people of color. This results in uneven access to public greenspace, less shade from trees, hotter temperatures, and poor air quality which can lead to more heat-related illness and asthma rates. Increased temperatures can place higher energy demands and financial burdens on people living in these areas, which will further strain health and household budgets as extreme heat becomes more common in the next few decades.
These implications underscore the need for comprehensive energy efficiency, clean energy, and urban planning strategies to mitigate adverse impacts. They also show that energy efficiency is an intersectional issue that must be advanced through collaborative efforts across sectors, including energy, public health, urban planning, and development.
Map of the Month – January
Grace Parker
Data Source: EIA Annual Electric Power Industry Report Form EIA-861 Dataset; Graph: SEEA
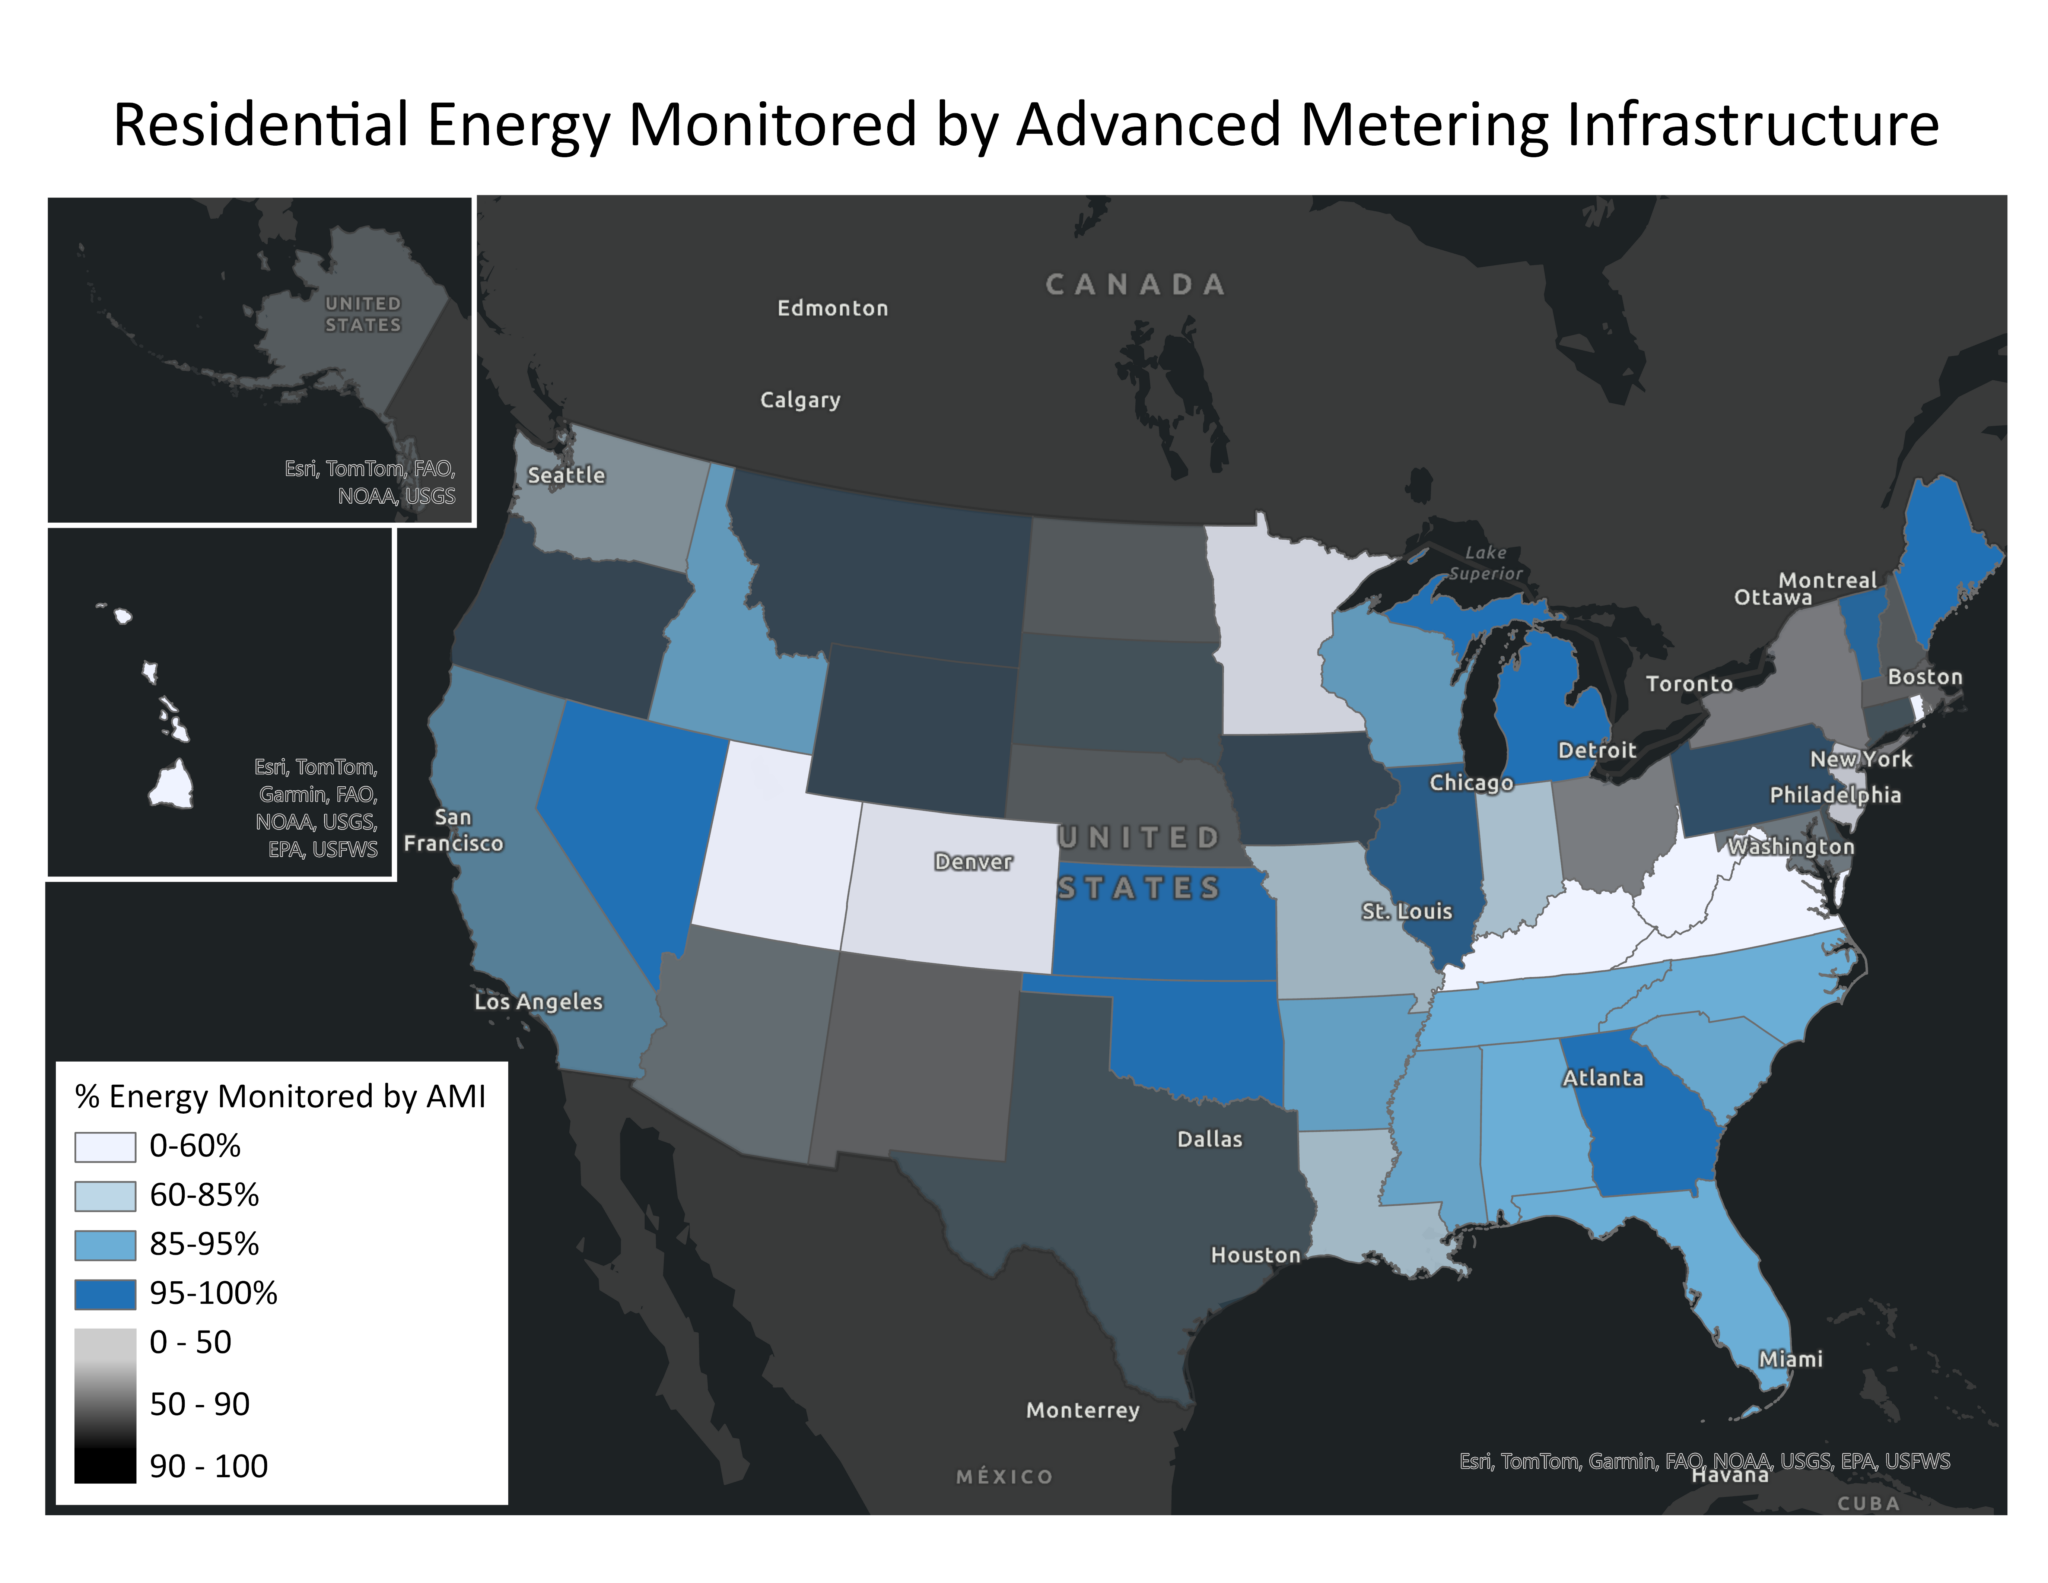
Accessing household energy data is critical to developing effective and evaluating efficiency programs, deploying energy assistance, and managing home energy use. Yet the accessibility of this data varies widely. One way to explore the accessibility of energy data is through Advanced Metering Infrastructure (AMI), a technology that monitors household energy usage, sends the encrypted data to the utility, and can communicate information back to the customer. A previous technology, Automated Meter Readings (AMR), allowed utilities to access real-time energy usage data but did not allow two-way communication with customers. The potential benefits of AMI include real-time energy adjustments by customers to lower bills, usage and outage notifications, and time-of-use pricing that encourages customers to shift energy use to times with lower energy prices. Because AMI provides granular data on energy usage, it can also be used to target and evaluate programs or policies for maximum impact and customer benefit.
This month’s map shows the percentage of residential energy sales (in MW) in each state that are monitored by AMI, as reported by electric utilities to the Energy Information Administration (EIA). The transparency of the map corresponds to how representative the data reported is of the state’s residential energy sales; states in which utilities report sufficient data for a high percentage of their energy sales appear opaque, while states in which utilities did not appear transparent. Both the percentage of energy tracked by AMI and the completeness of the data reported by utilities vary dramatically. The Southeast overall has a high rate of adoption with six states exceeding 90 percent of energy monitored by AMI, and the Southeast has some of the most complete data in the United States. In areas with low AMI adoption rates, its cost may be a barrier. AMI is more expensive than AMR, so ratepayers would first have to pay for the upgrade before realizing energy savings.
Even in areas that appear to have high adoption of AMI, there may still be barriers to accessing the data. A report by Mission: data national coalition of technology companies that works on energy data access—found that of the more than 17 million advanced meters funded by the American Recovery and Reinvestment Act in 2009, less than 3% have real-time data features enabled.
Some customers may even be unaware that they have AMI. According to the Residential Energy Consumption Survey, only 28% of households in the U.S. reported having an electricity “smart meter” in 2020, despite utilities reporting that about 65% of residential customers had one.
The data used in this map, which is reported unevenly to EIA and only covers around 70% of residential energy sales in the United States, underscores additional barriers to energy and data accessibility. As regulators and researchers continue to address data access issues, they must work with utilities to ensure the full benefits of AMI are realized and to understand the challenges to obtaining and reporting complete, high-quality data.
To this end, SEEA is launching a working group, as part of our Southeast Energy Insecurity Project (SEIP), to explore pathways to build data transparency around energy and housing data so that this data can be leveraged to address energy insecurity through policies and programs. If you, or your organization, are interested in digging into this issue as a member of a SEIP working group, please reach out to Will Bryan, SEEA’s Director of Research, at wbryan@seealliance.org.