

How Much Work is Required to Pay Energy Bills? September Map of the Month
By Dr. Amy Lovell
Senior Research Associate, Southeast Energy Efficiency Alliance (SEEA)
There is rising concern about energy affordability in the Southeast, with fuel costs and rates rising due to both domestic and international influences. The U.S. Bureau of Labor Statistics reports that costs in the South region have continued to rise, led by housing-related costs including energy, and transportation costs driven by a 29% increase in motor fuels since this time last year. Growing electricity demand and even higher projected future electricity demand has people wondering where new electricity generation will come from and what impacts ratepayers will feel from how states and utilities plan to build what is needed. With already strained household budgets for housing, medical, and transportation costs, high utility bills are becoming harder to absorb. All of this has focused national attention on household energy affordability.
This month’s map investigates energy affordability and some ways that we measure it in the Southeast. SEEA’s executive director, John Silkey, wrote a recent op-ed focused on the income side of affordability. Here, we dig into affordability across the Southeast and connect it to workers’ wages: How much extra work would a household need to take on just to make energy affordable?
One way to estimate the gravity of energy cost impacts is to express those costs as a fraction of household income, often known as “energy burden.” The U.S. Department of Housing and Urban Development’s (HUD’s) affordability guidelines are based on keeping overall housing costs at or below 30% of a family’s income. If energy costs exceed 20% of housing expenses, or >6% of the residents’ income, the household would be considered to have a high burden from those costs. Severely burdened households spend over 10% of their annual income on energy expenses. These costs put pressure on budgets for food, medical care, and other housing needs, causing many energy-burdened families to have to forgo essentials to pay for energy, and deepening existing vulnerabilities for low-income households. In addition to household energy costs, high and unpredictable fuel costs for transportation add financial strain.
Since affordability is often characterized relative to household income, it is important to zero in on energy expenses for low- and moderate-income (LMI) household, because bulk averages may mask affordability challenges. LMI households have incomes at or below 80% of the area median income (AMI), as tabulated in the Low-Income Energy Affordability Database (LEAD) at the U.S. Department of Energy.
In the Southeast, energy burdens are regionally high for LMI households: only Florida, Virginia and North Carolina are below 8%, which is already above the 6% considered to be a financial burden. Alabama, Louisiana, and Mississippi are all over the 10% severe threshold, indicating a significant affordability challenge in these areas. Energy costs vary by state and by housing type, but average around $1800/year or $150/month for low-income households across the region.
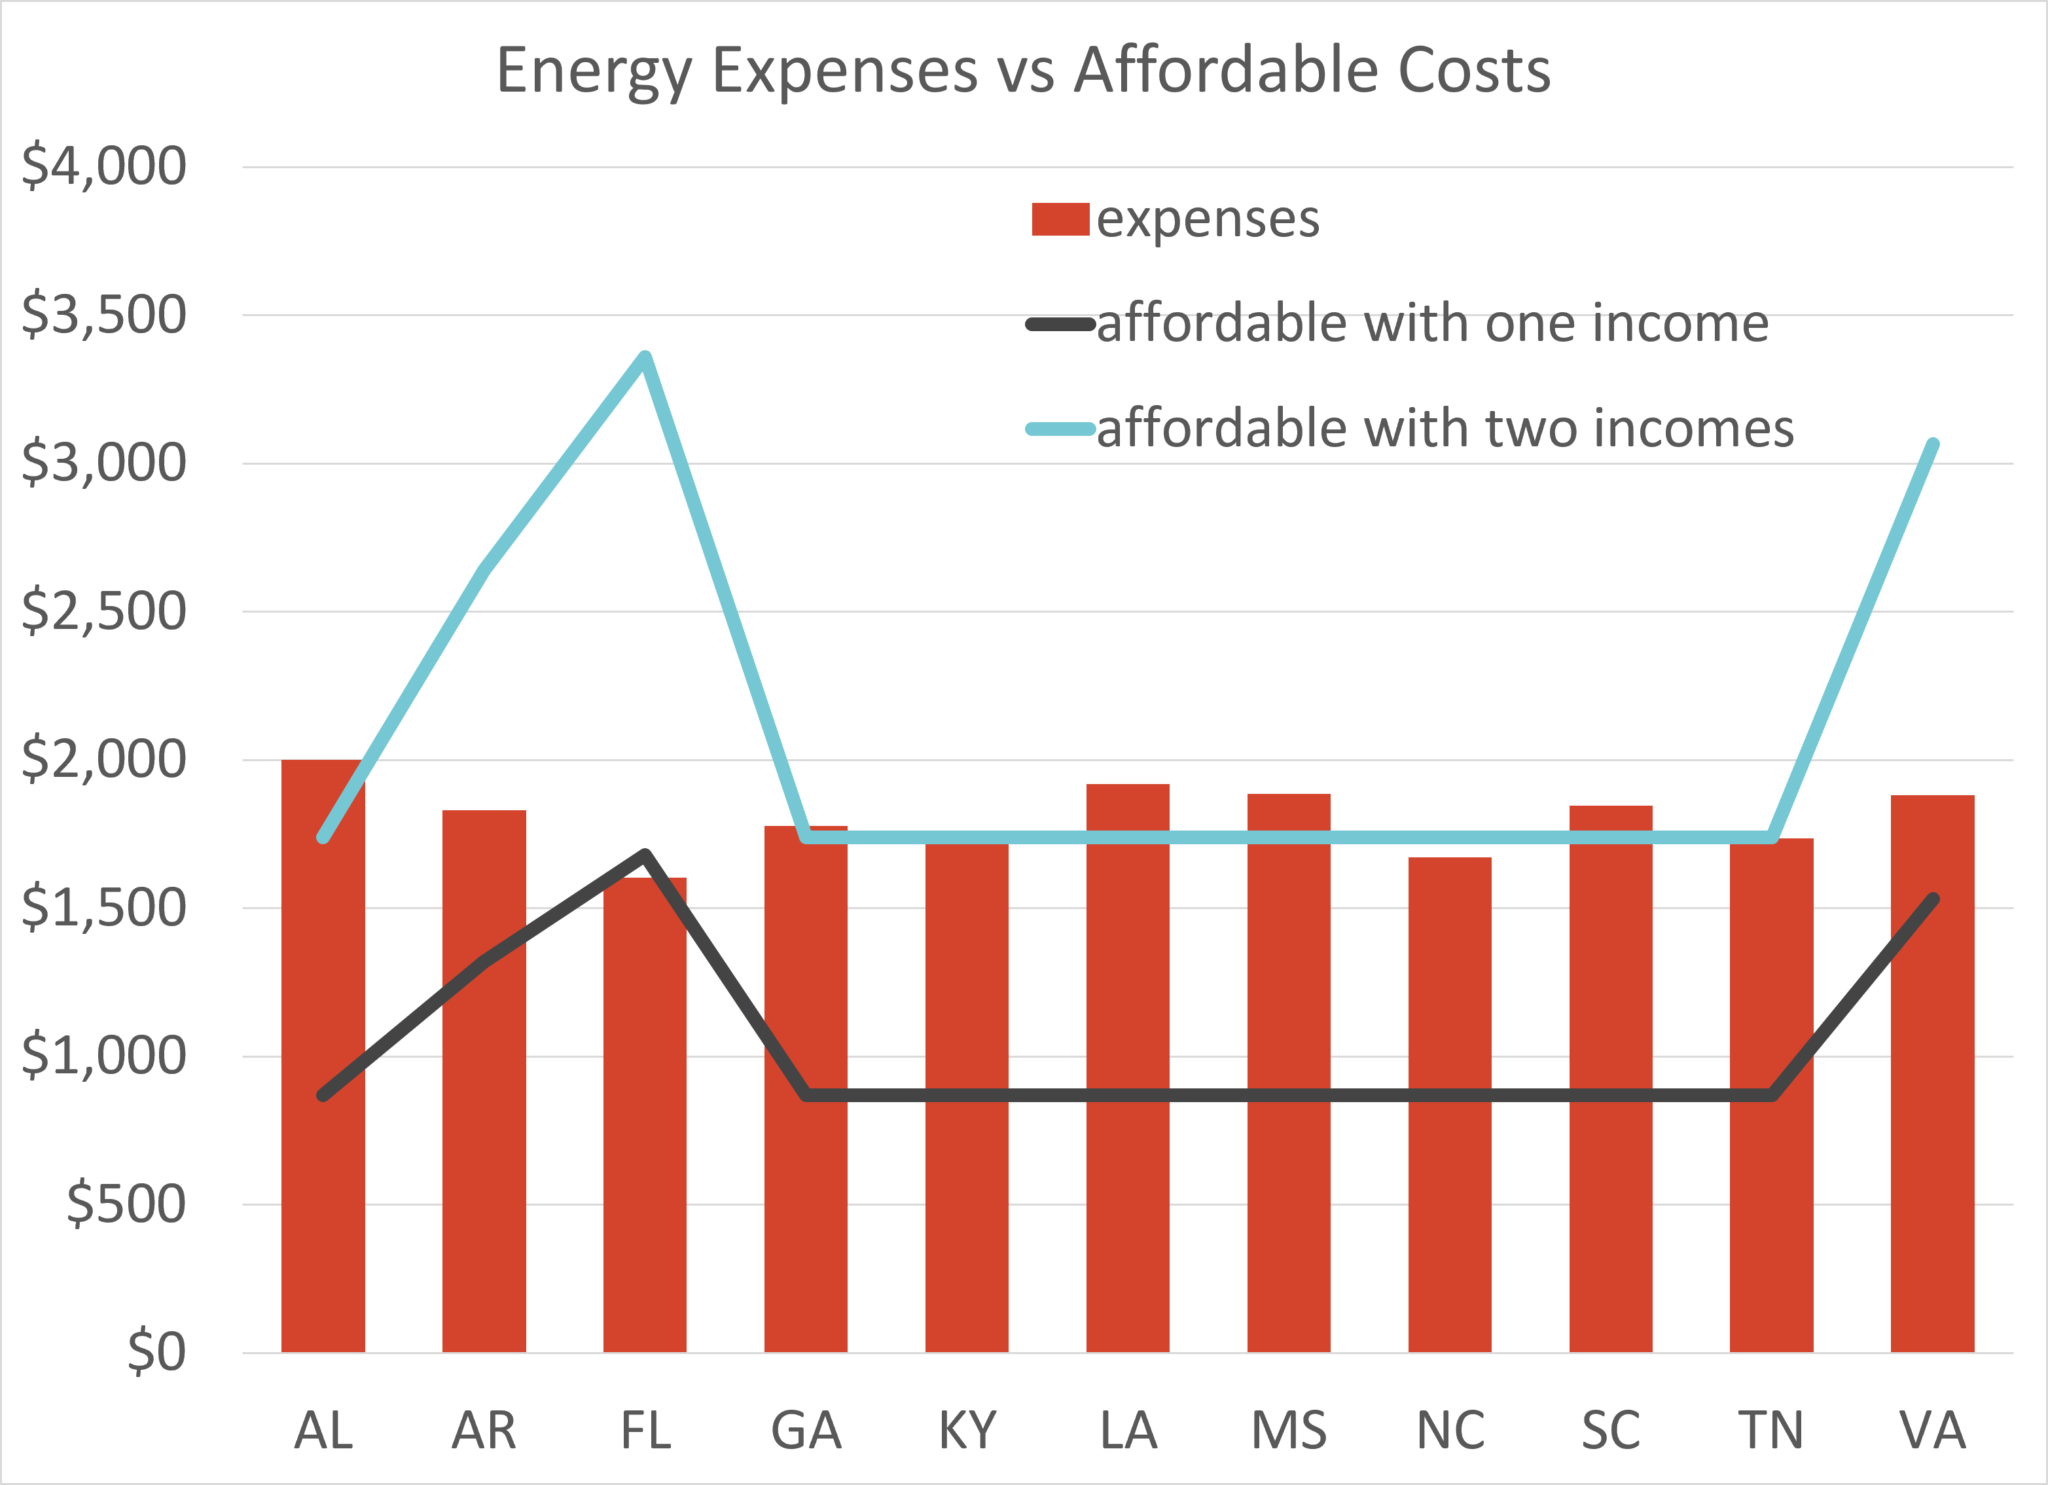
Assuming a full-time minimum-wage job, average energy costs represent a high energy burden in every Southeastern state. In Alabama, Georgia, Kentucky, Louisiana, Mississippi, South Carolina, and Tennessee, average energy expenses require more than 6% of two minimum wage incomes, as shown in the chart below.
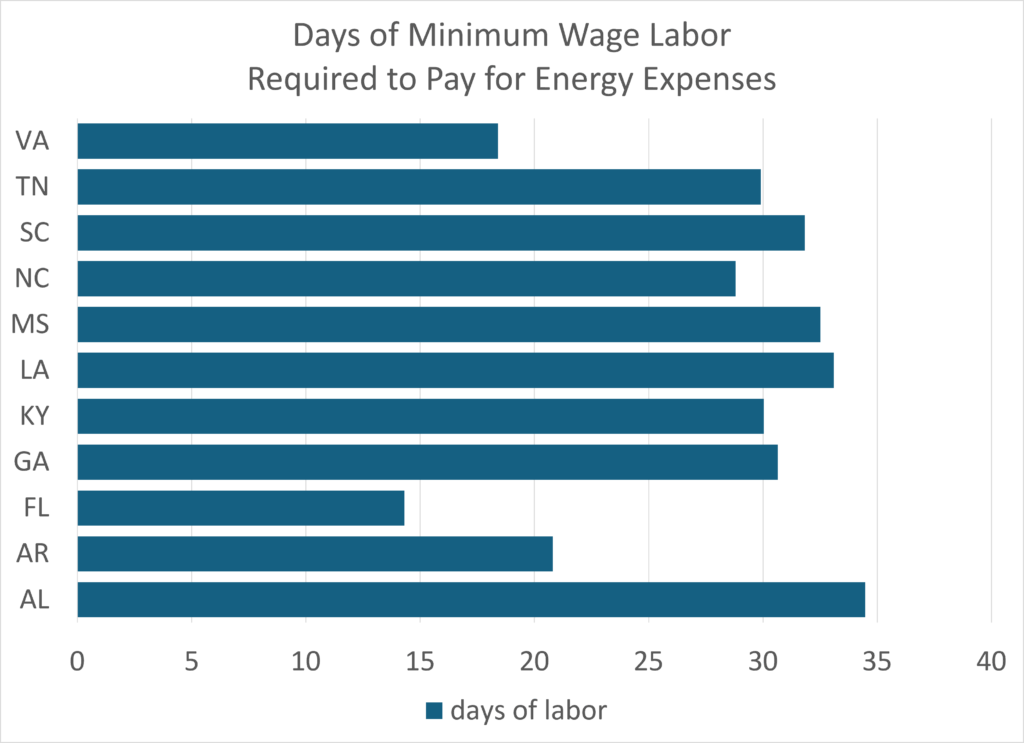
Also illustrated below is the number of days of full-time labor at minimum wage that would be required each year to pay the average LMI energy expenses. In the majority of Southeastern states, more than a month of full-time salary is required to meet typical energy costs.
Another metric that can be used to assess energy-related financial challenges is the energy affordability gap (EAG), a measure of the difference between actual expenses and an affordable level of expenses. The EAG provides an indication of how much funding would really be required to address affordability, so can reveal geographies in greatest need of investments. Energy affordability gaps are over $500/year for an average low-income family in Alabama, Louisiana, or Mississippi, and would require more than 2 weeks of extra full-time work at minimum wage to close the gap.
The Energy Equity Explorer (EEE), a collaboration between SEEA and the Texas Energy Poverty Research Institute (TEPRI), is a tool that we developed for visualizing and analyzing energy costs and burdens, with a focus on low-income household data from multiple public data sets. If you’d like to investigate low-income energy affordability influences in your area, try the tool! Questions you could pursue include:
- Where are energy burdens the highest? How does it vary between urban and rural communities?
- How do renters fare compared to homeowners?
- Do affordability challenges correlate with other social vulnerabilities?
- Which housing types and ages have higher costs and affordability challenges?