
Map of the Month – February
Few things have impacted cities today as much as the suite of policies and practices that segregated neighborhoods on the basis of race over more than a century. Housing segregation had existed in practice for decades before the 1910s when white policymakers enacted the first racial zoning laws. Although these laws were declared unconstitutional by the United States Supreme Court in 1917, white city officials throughout the South still found ways to advance racial residential segregation.
Map of the Month – January
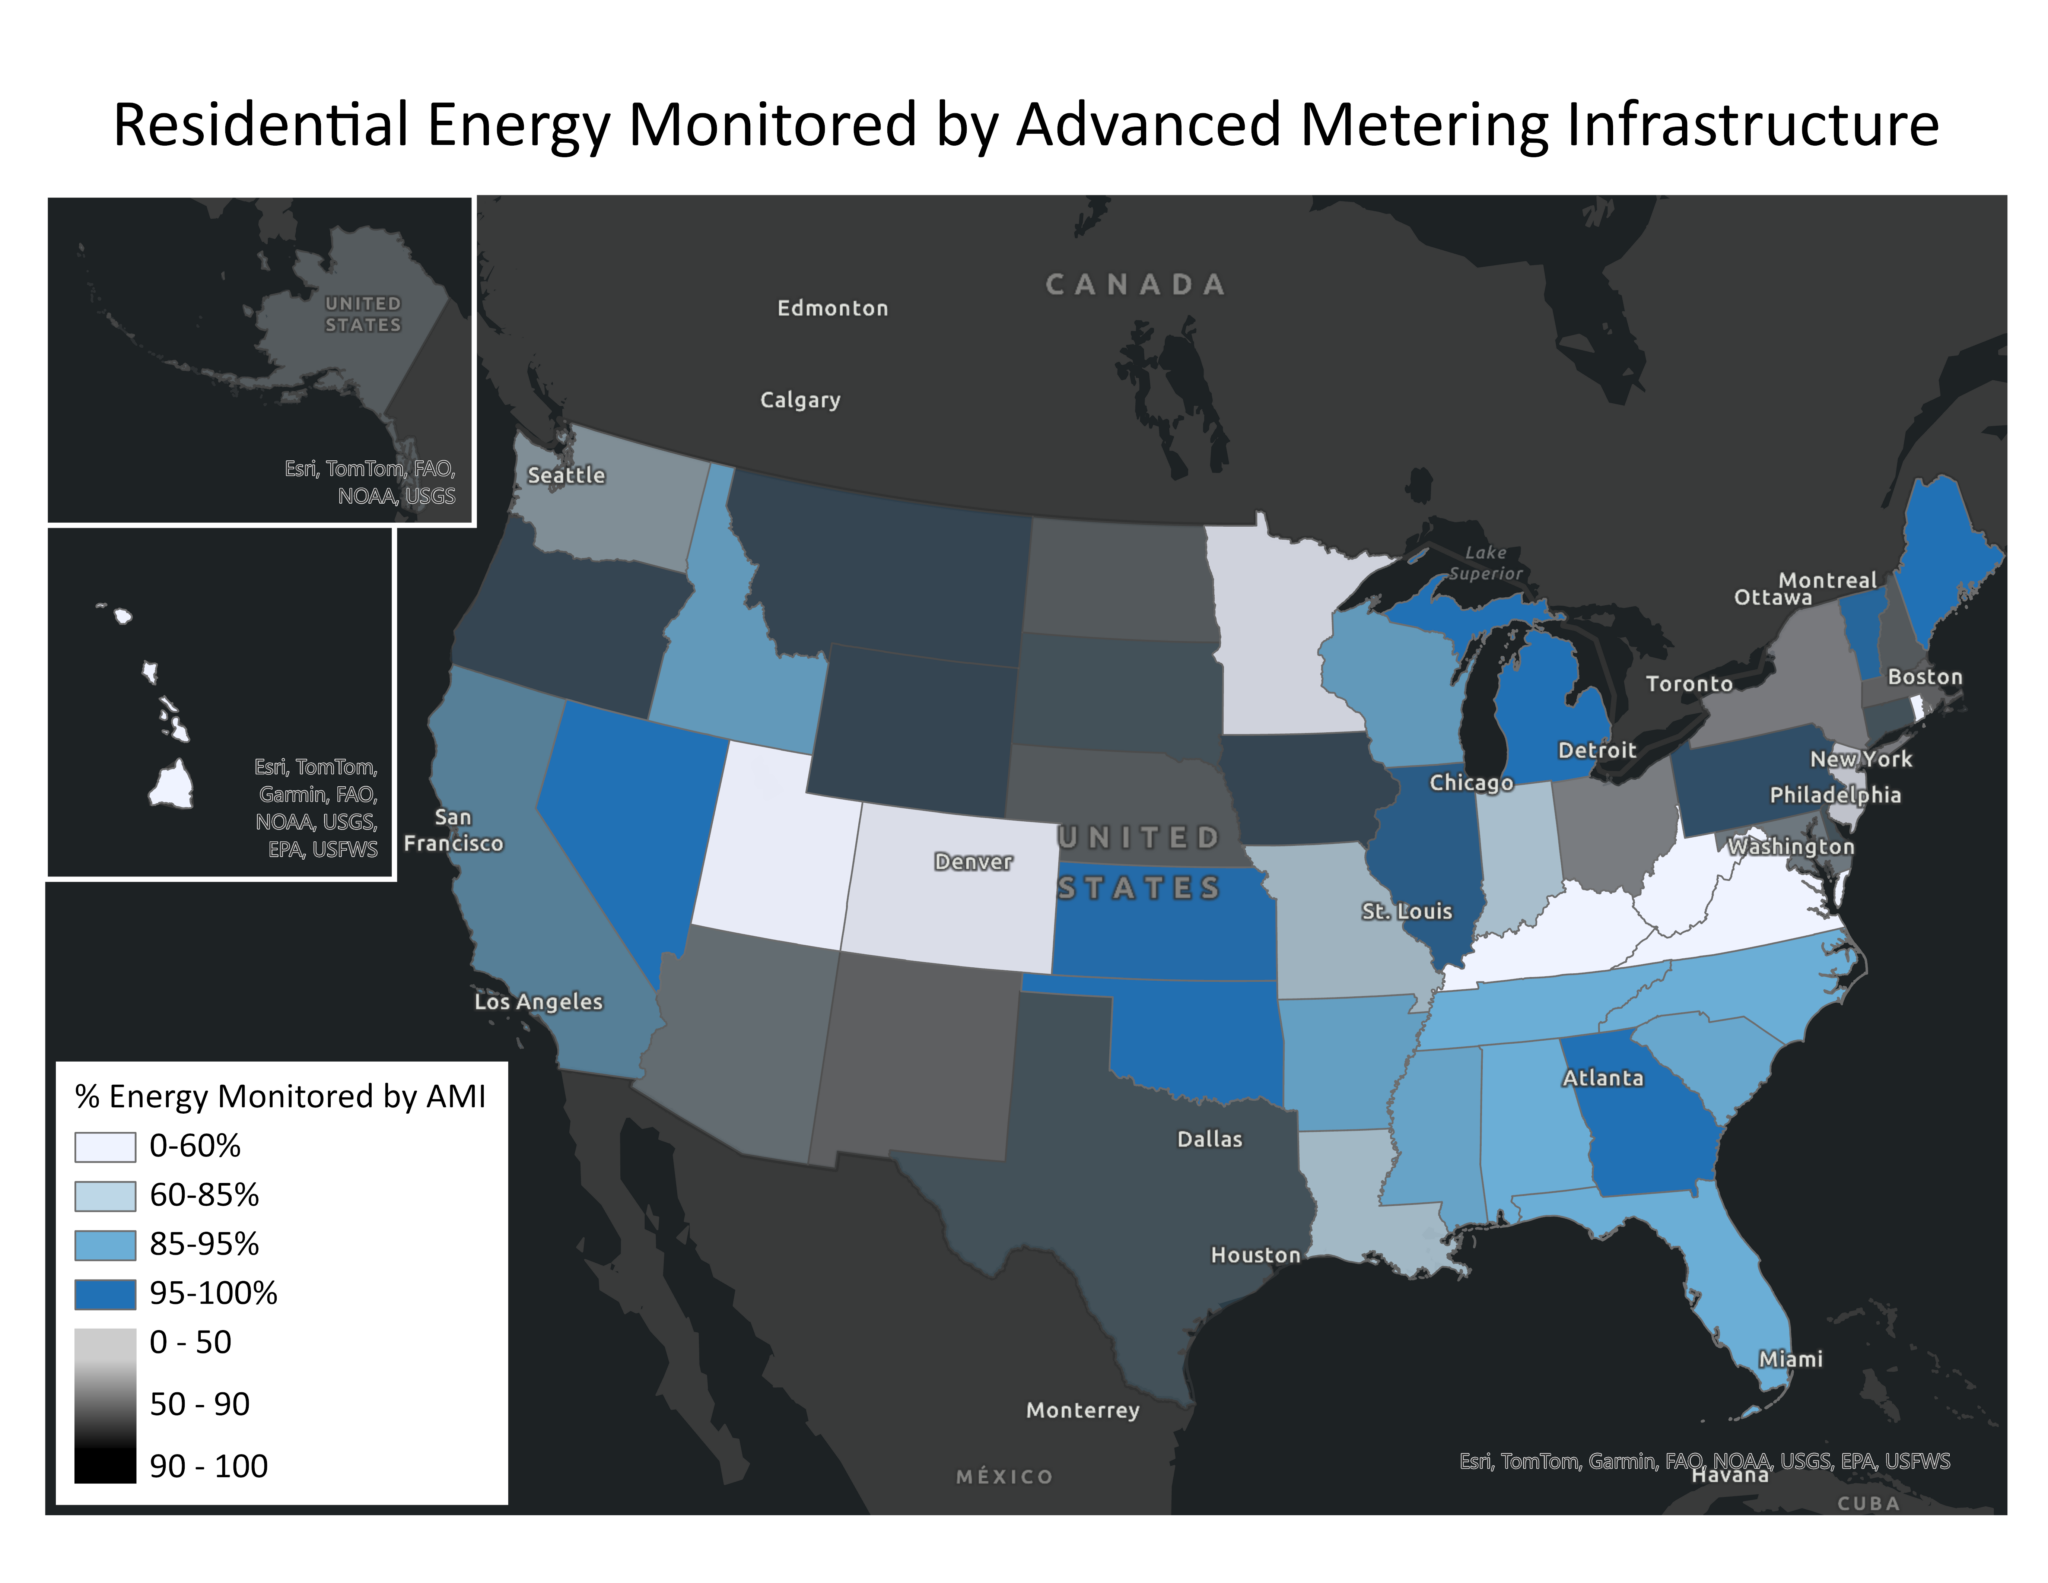
Accessing household energy data is critical to developing effective and evaluating efficiency programs, deploying energy assistance, and managing home energy use. Yet the accessibility of this data varies widely. One way to explore the accessibility of energy data is through Advanced Metering Infrastructure (AMI), a technology that monitors household energy usage, sends the encrypted data to the utility, and can communicate information back to the customer.
Growth of electric vehicle infrastructure offers hope for repair and renewal

SEEA is committed to acknowledging the influence of historic racism within the energy sector and related industries such as healthcare, insurance, housing finance and transportation. Racial segregation has always been a part of our country’s transportation systems and these historical inequalities still impact energy efficiency and transportation equity today. SEEA is developing a set of maps that illustrates how transportation infrastructure places additional burdens on people of color, and how zero emission public transit, fleets, and personal vehicles can address these issues.
2023 Election Highlights

With a national election occurring next year, there is increased media attention on local candidates’ economic, social and foreign policy platforms. This fall, the Southeast held four key elections in Kentucky, Louisiana, Mississippi and Virginia, which highlighted the tension between federally funded clean energy initiatives and traditional gas, oil and coal industries.
Map of the Month – December
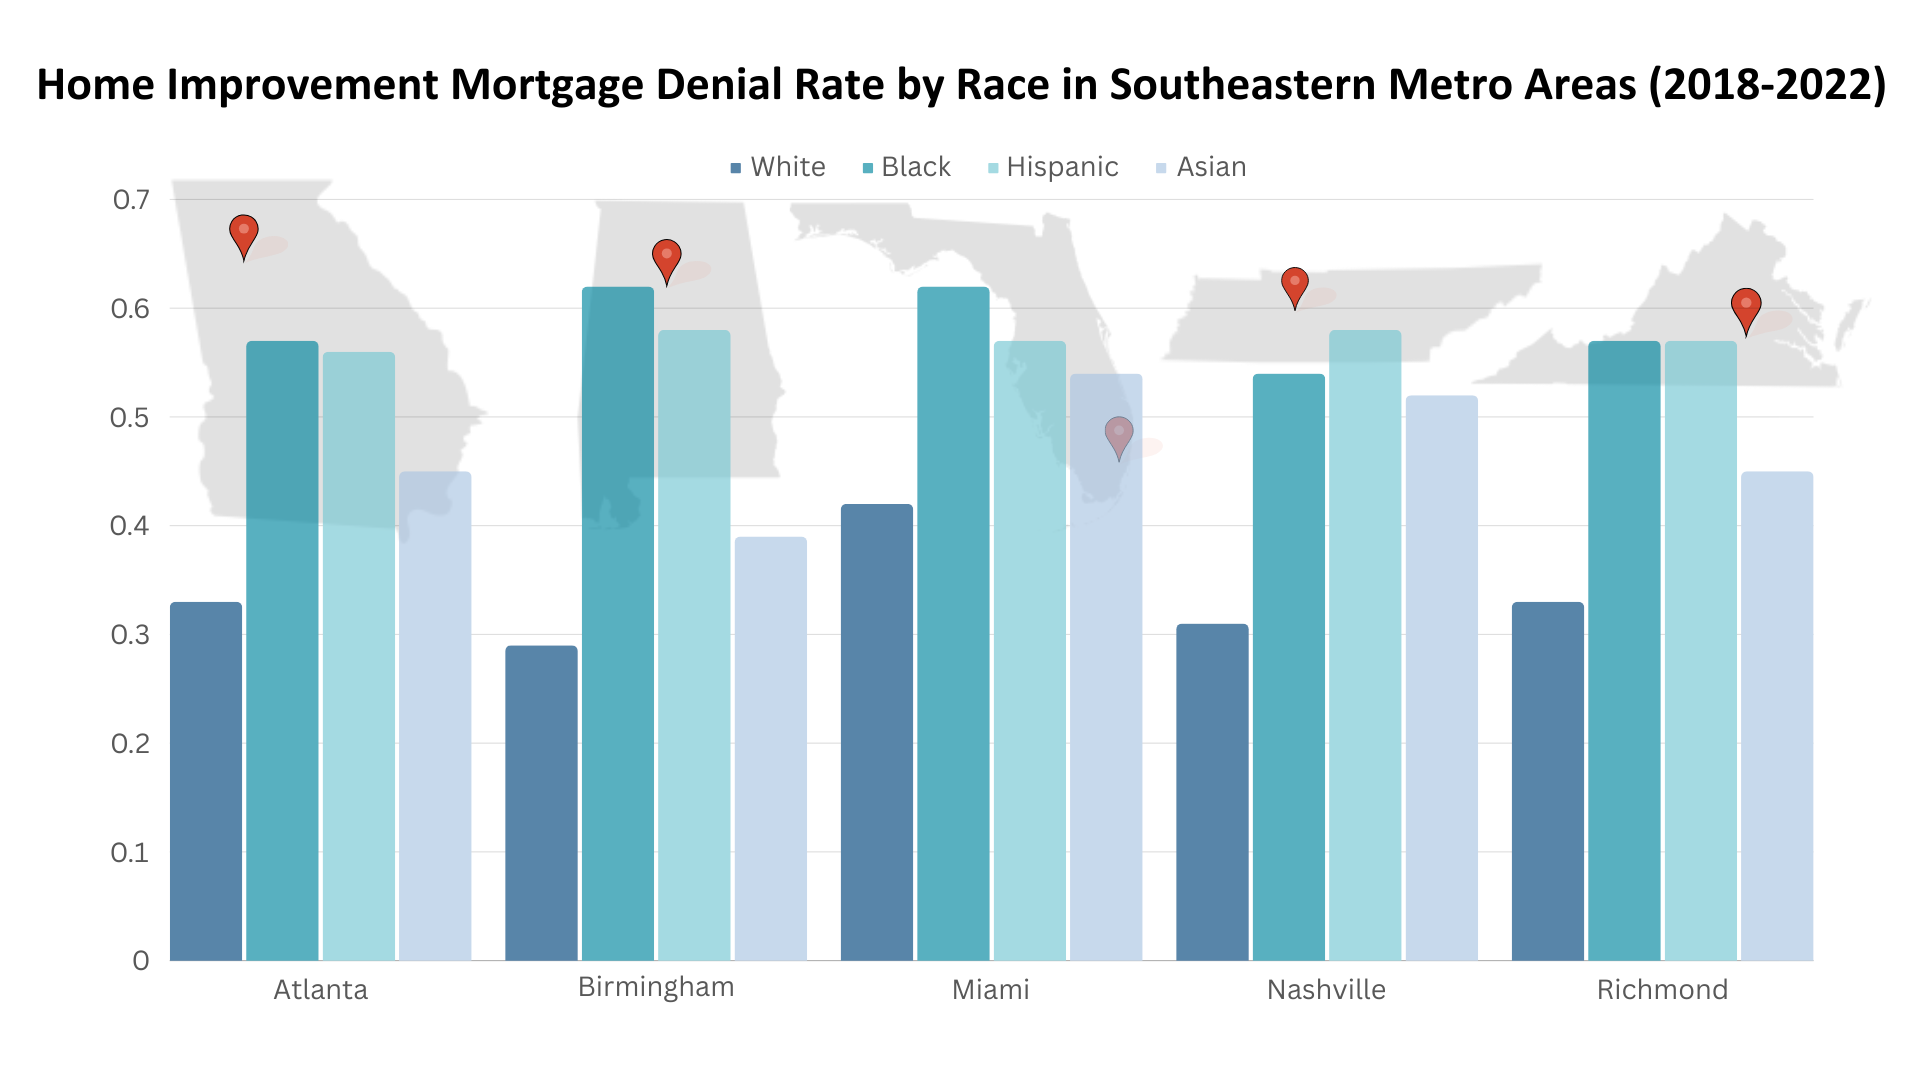
Following last month’s map that explored home purchase mortgage denial rates by race, this month’s map shows home improvement mortgage denial rates by race in five Southeast cities: Atlanta, Birmingham, Miami, Nashville, and Richmond. Like mortgage loans for home purchases, we found wide disparities between racial groups in their ability to access lending for home improvements.
Southeast Energy Efficiency Alliance Announces New Board of Directors and Advisory Committee Members

ATLANTA, GA – The Southeast Energy Efficiency Alliance (SEEA) today announced new members of the Board of Directors and its Advisory Committee. “We are honored and excited to welcome this […]
Map of the Month – November
Redlining and other forms of housing segregation officially ended in 1968 with the Fair Housing Act, but access to lending still differs depending on a person’s race. People of color are still more likely to be denied access to mortgage lending than white people.
Southeast Energy Efficiency Alliance Announces 2023 Summit Award Winners

The Southeast Energy Efficiency Alliance (SEEA) announced the winners of the inaugural Summit Awards – The Peak Award for Excellence in Leadership, the Luminary Award for Pursuing Energy Equity and […]
Map of the Month – October
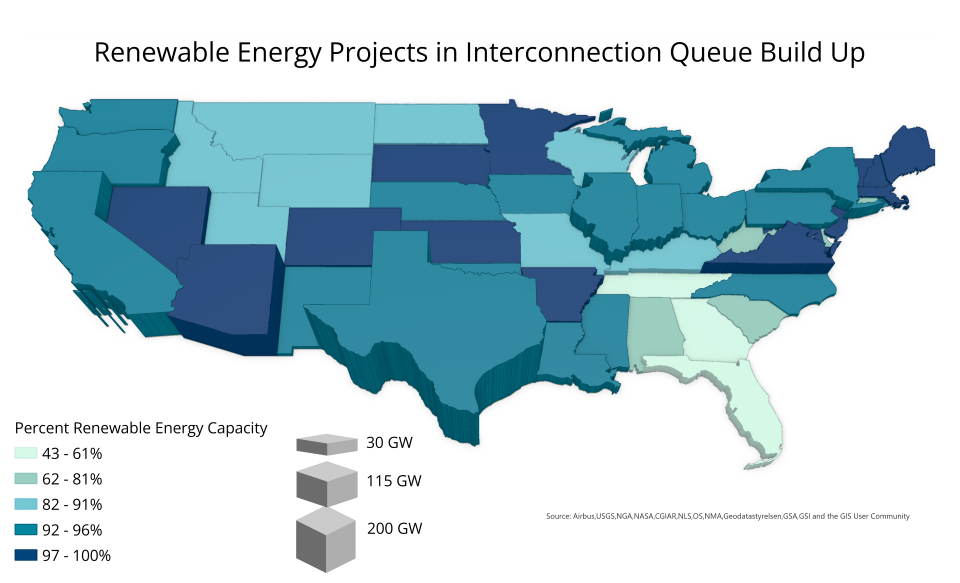
The Inflation Reduction Act (IRA) and other recent federal developments provide unprecedented opportunities to hasten the energy transition through the development of renewable energy resources. Yet this progress is being hindered by the backlog of energy projects waiting in the interconnection queue, a phase in which energy developers request to connect to the power grid and complete studies about the impact of these connections. The number of projects waiting in the nation’s interconnection queue grew by 40 percent in 2022 as more renewable energy projects were greenlit. The amount of time each project spends in the queue is also growing. Projects completed in 2022 spent an average of five years in the queue, compared to less than two years for projects completed in 2008.
Map of the Month – September
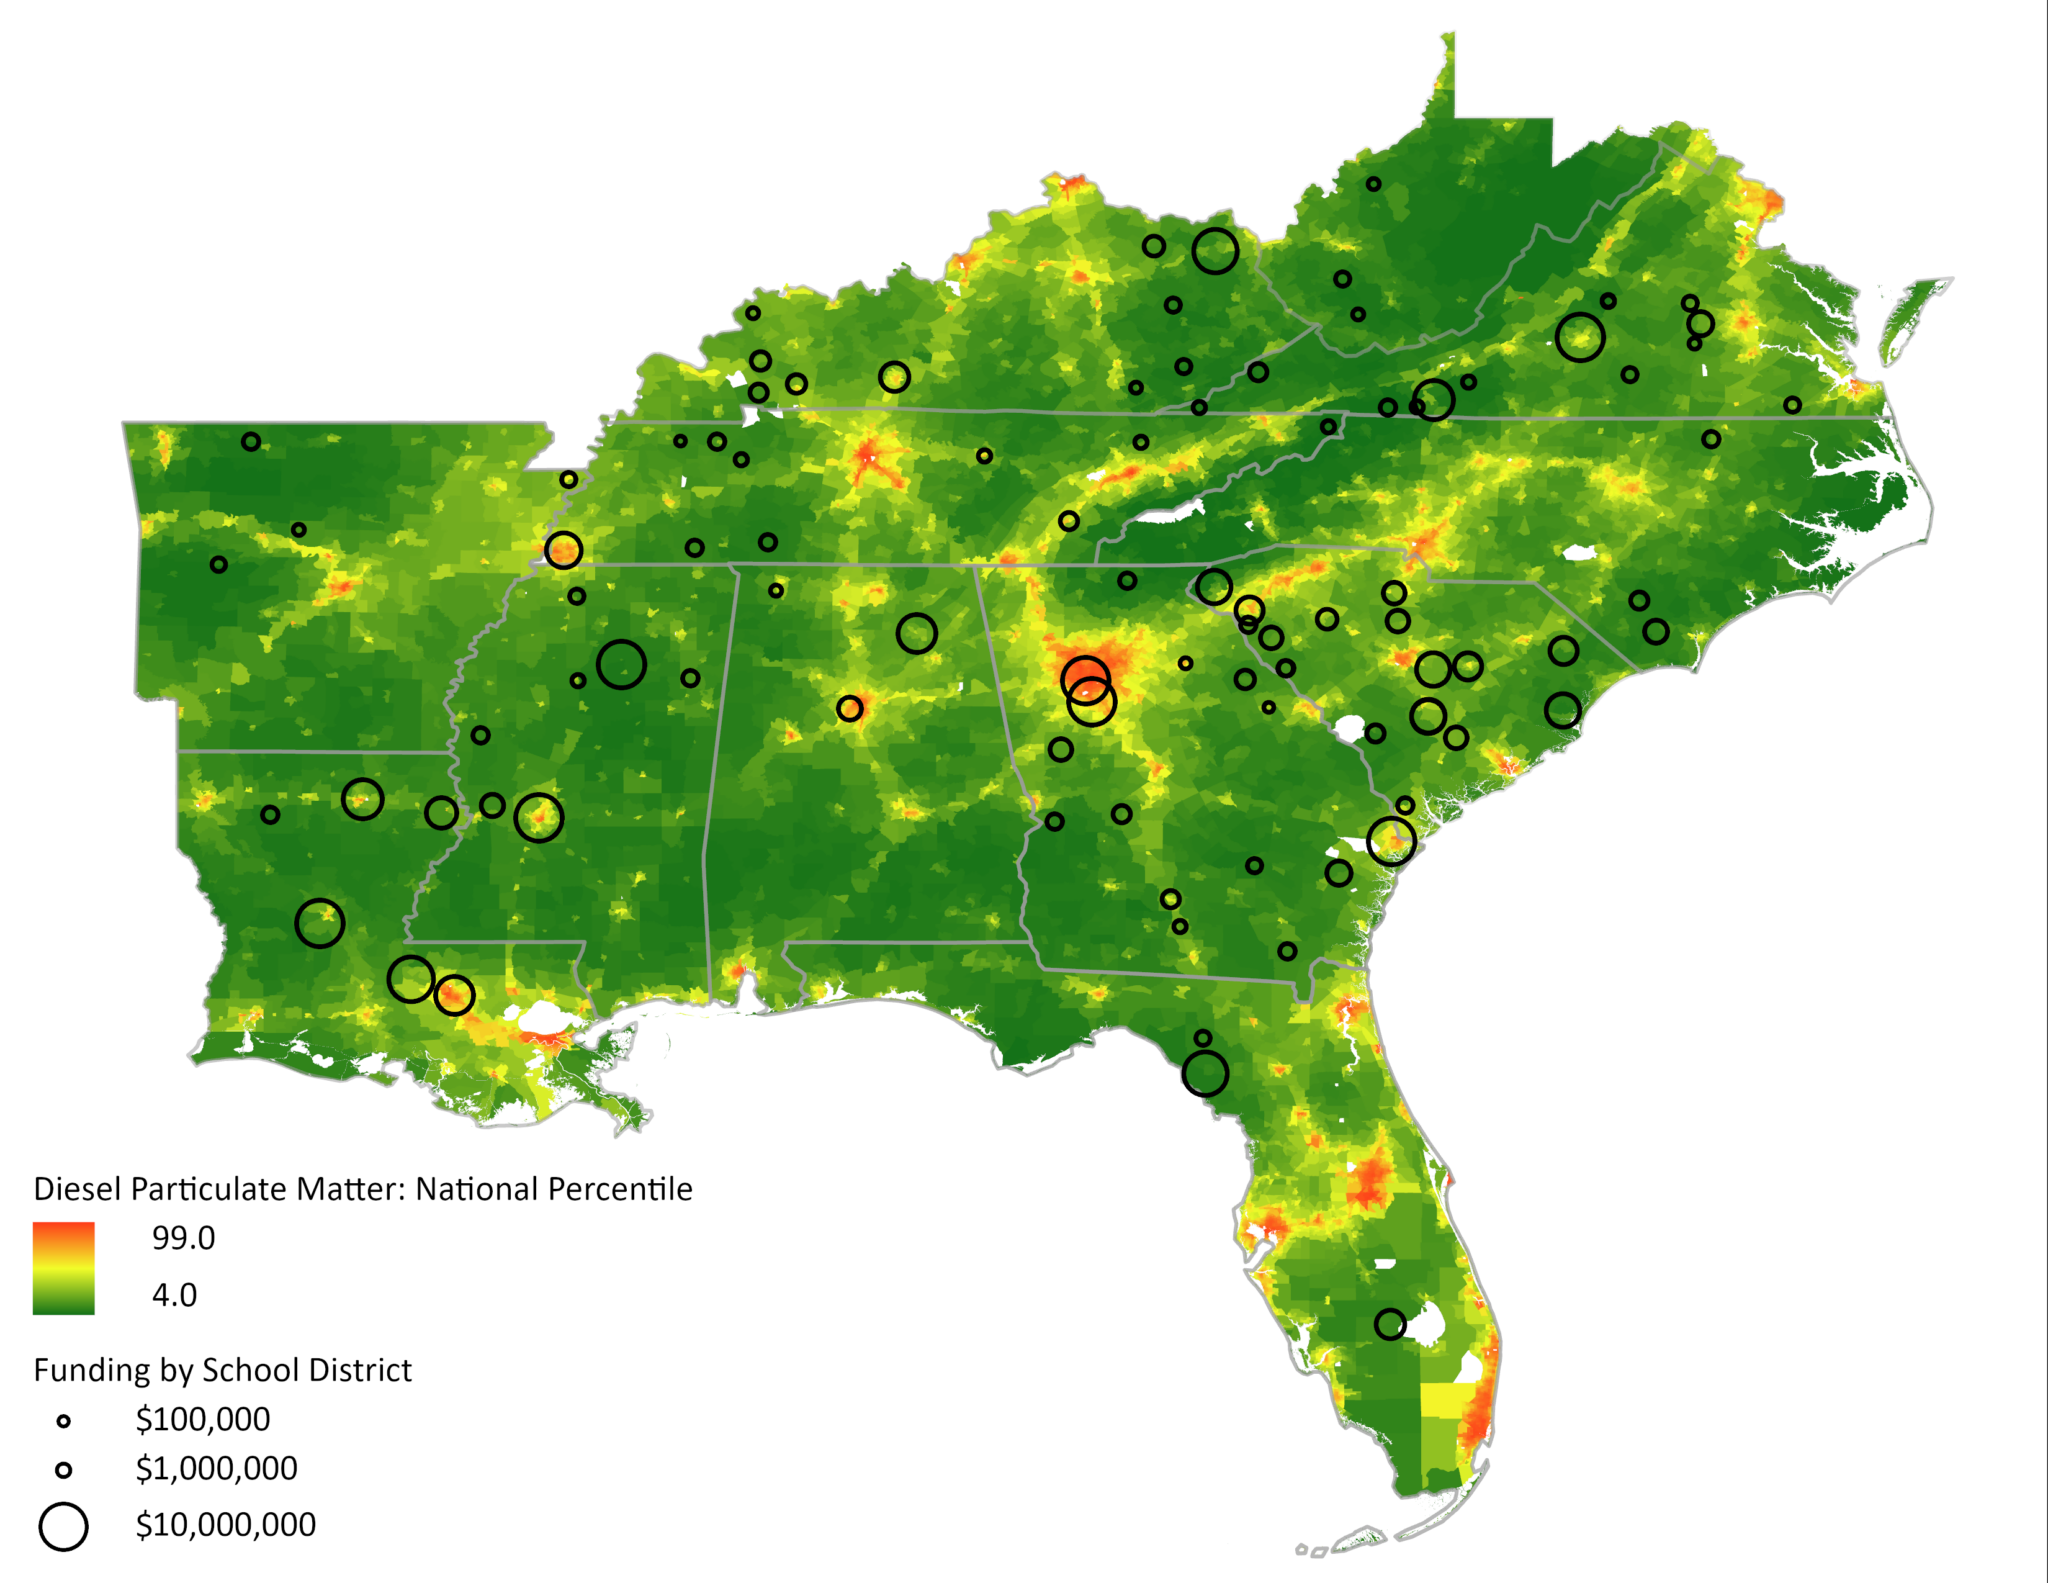
The EPA’s Clean School Bus Program aims to reduce greenhouse gas emissions and exposure to air pollution by replacing older school buses with low-emission and zero-emission models. Has that funding reached the communities most impacted by the harmful effects of diesel school buses?