
June Map of the Month
Transportation Costs and Burdens Across the Southeast
Transportation Costs and Burdens Across the Southeast
Source: Center for Neighborhood Technology
Transportation is a vital household need. Without access to reliable transportation, people may struggle to hold down a job, get their kids to school, get groceries, and obtain medical care. We live at a time when there are more forms of transportation available than ever before, but often transportation access is defined by affordability and the built environment.
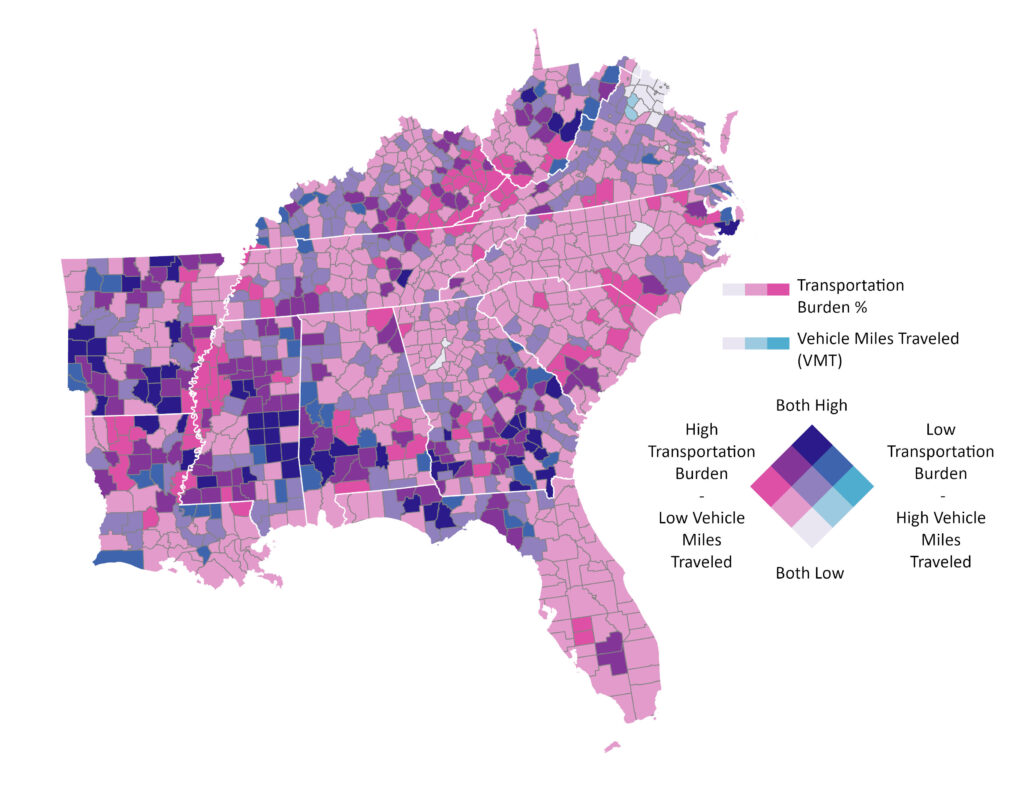
A household is considered transportation burdened when it spends 15% or more of its annual income on transportation. The widely accepted threshold for combined housing and transportation affordability is 45% of household income, with no more than 30% going to housing and 15% to transportation. Yet a recent U.S. Bureau of Labor Statistics report found that in 2024, American households spent an average of 50% of their income on housing and transportation combined, well above that threshold.
This month’s map draws on data from the Center for Neighborhood Technology’s (CNT) Housing and Transportation (H&T) Affordability Index to visualize transportation burden and annual vehicle miles traveled for moderate-income households across the Southeast. As CNT describes it, the H&T Index expands the conventional definition of housing affordability (rent and utilities) to include transportation costs, so that households and policymakers better understand the true cost of where people live. The model captures costs across three categories: auto use, auto ownership, and public transit use.
In the Southeast, the most transportation-burdened households are concentrated in rural areas along the Appalachian Mountains, the Mississippi Delta, and in the Black Belt, where limited transit infrastructure and low-density development make car ownership not a choice but a necessity. The 13 most highly burdened census tracts fall across West Virginia, Kentucky, Louisiana, Mississippi, and Georgia.
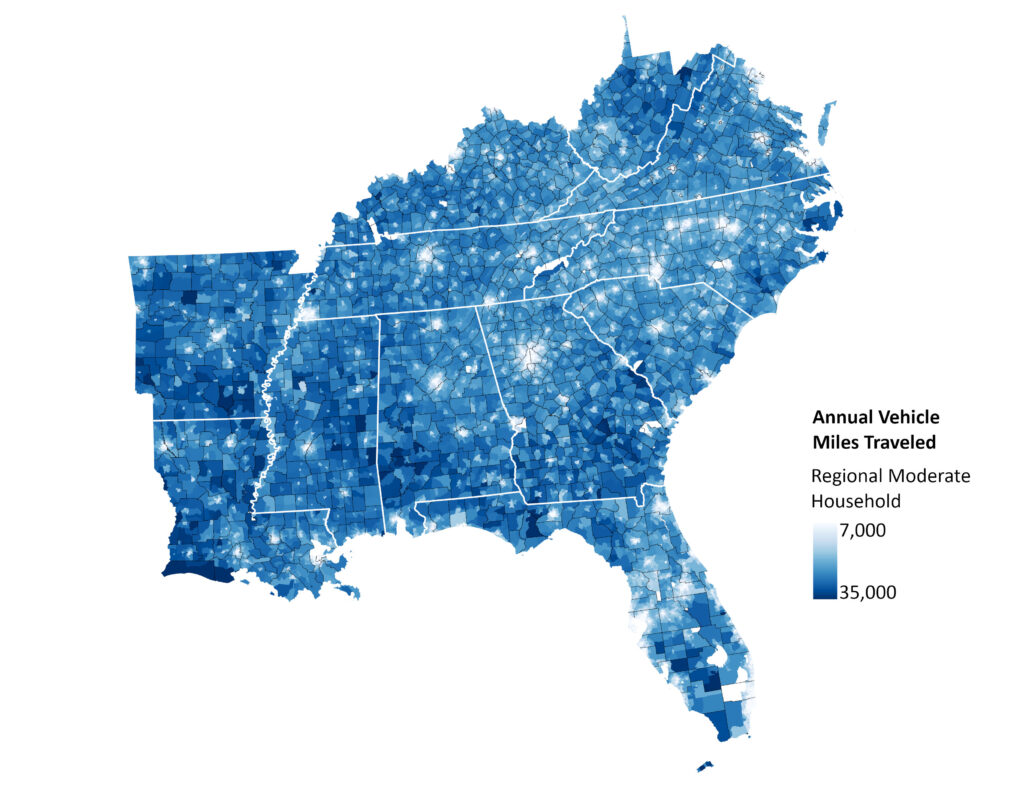
Vehicle miles traveled data confirm what the burden maps suggest: Urban areas are the most transportation-efficient locations, where density and transit access reduce dependence on personal vehicles.
A 2024 study published in the Journal of Transport Geography found that, compared with urban areas, rural areas in the United States have less connected pedestrian, bicycling, and transit infrastructure. Rural residents also tend to travel longer distances to access essential services and opportunities, resulting in a form of “forced car” reliance. At the same time, lower incomes and higher poverty rates among rural populations can increase the financial burden of transportation.
These local patterns are compounded by a national surge in transportation costs since 2020. New car prices have risen approximately 29% since March 2020, while used car prices have climbed about 34%, both outpacing overall inflation, as shown by the consumer price index (CPI) charts below.
Car insurance costs have also risen 56% since January 2020, according to BLS data, though premiums saw a slight dip in 2025. For households that rely on gasoline, costs have been particularly volatile, as pump prices remain susceptible to geopolitical disruptions and global supply shifts.
These affordability issues strain household finances most for low- and moderate-income households in the Southeast, who have the highest vehicle miles traveled (VMT) and experience the highest transportation burdens. Faced with these pressures, many consumers are turning to used electric vehicles as a more affordable alternative.
Taken together, these findings provide a data-driven lens for identifying where transportation burden is most acute in the Southeast and where targeted investments, whether in transit service, pedestrian and bicycling infrastructure, EV infrastructure, or land use policy, can have the greatest impact.
SEEA’s Energy Efficient Transportation portfolio works to address these challenges across the Southeast through EV policy guidance, utility electrification programs, and technical assistance to help states and communities expand access to cleaner, more affordable transportation options.
Data Considerations
The maps here draw on CNT’s 2022 data, which remains among the most comprehensive available. Yet many national datasets do not track transportation burden at a granular level, and key sources like the U.S. DOT’s Local Area Transportation Characteristics for Households (2017) and HUD’s Location Affordability Index (2019) predate the cost spikes we have seen since 2020. As transportation costs continue to shift, updated and locally specific data will be essential for planners and policymakers to understand the true scale of the affordability crisis facing our region.