
Month: November 2025
November Map of the Month
By Will Bryan

It’s no secret that projected electric loads throughout the nation are unprecedented, but particularly in the Southeast. A recent analysis by ICF estimates that U.S. electricity demand will grow by 25% in the next four years, and 78% by 2050, compared to a 2023 baseline. Much of this load growth will happen in the Southeast, driven by a combination of electrification and the siting of large commercial customers.
Many electric utilities are considering building new generation to manage this unprecedented growth; load flexibility, however, will be a critical tool to maintain grid stability, promote customer affordability, reduce the environmental impacts of generation, and ensure that we have the energy to meet all our needs.
This month’s map uses data from the U.S. Energy Information Administration (EIA) to explore the state of utility-administered demand response programs in 2024, the most recent year data was available. Demand response refers to a range of programs that are designed to reduce customer usage during peak events, including through the installation of smart thermostats or variable pricing, among others.
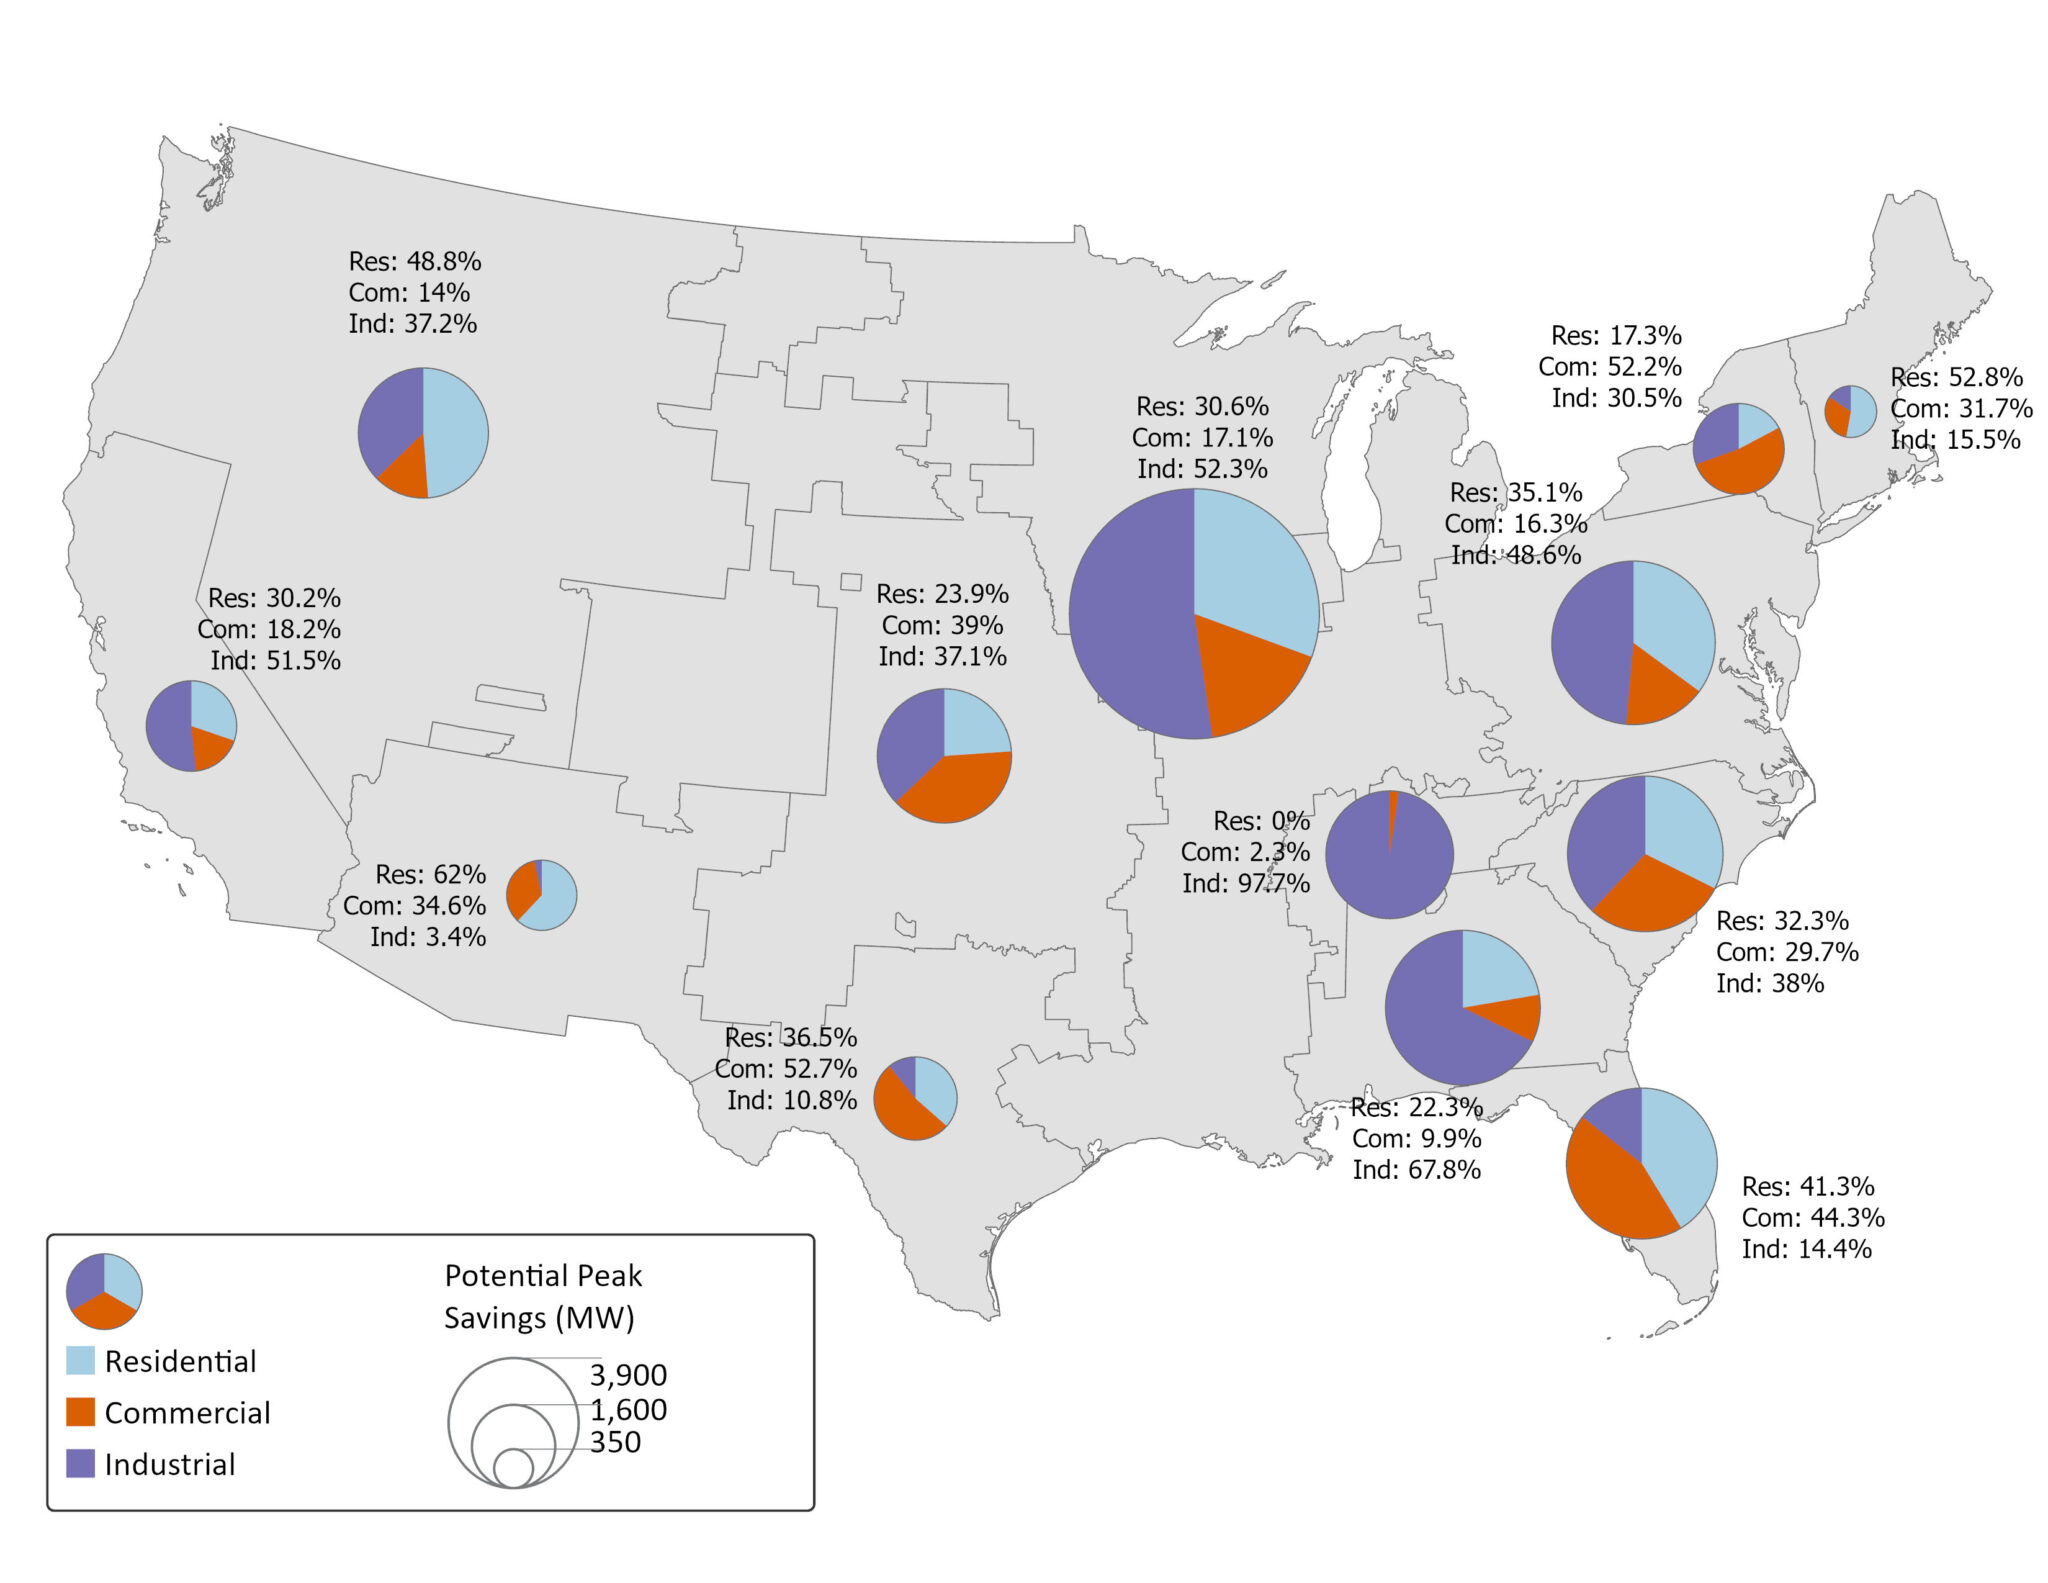
Utilities of all types have enrolled 2.7 million residential, commercial, and industrial customers in demand response programs across the South. These programs have created the capacity to save approximately 13.34 GW of peak energy use. In 2024, demand response reduced the peak demand by 2.89 GW, the amount of power generated by about three nuclear reactors. Utilities in the Midwest, mid-Atlantic, Carolinas, and Southeast balancing authority regions lead the nation in terms of potential peak capacity reductions available through demand response programs.
As the pie charts in this month’s map show, utilities take different approaches to balancing their programs across multiple sectors. While peak savings in the Southern and Tennessee balancing authority regions are driven largely by the industrial sectors (seen in purple on the pie chart), other parts of the South, such as Florida and the Carolinas, show a greater reliance on residential and commercial demand response approaches.
Demand response is transformational work. It stabilizes the grid during critical events and protects customers from the costs of new infrastructure investment. However, to meet future load projections, these programs must be scaled up rapidly to help meet the projected need.
Expanding demand response offers additional peak-shaving capability, especially when paired with energy efficiency and other distributed energy resources. Demand response is a proven, effective tool. The challenge now is to scale it to meet the emerging demand.
October Map of the Month
Beyond Adoption: Measuring the Efficiency Impact of State Amendments

Code: The model energy code edition that a state has officially adopted — IECC for residential buildings or ASHRAE Standard 90.1 for commercial buildings.
Strength: The actual rigor of that code after state amendments — shown as the equivalent edition it matches and the percent change in efficiency compared to the unamended base.
Impact (Δ%): The efficiency impact of amendments on the strength of the code — negative values mean the code was weakened, positive values mean it was strengthened.
Code Adoption
Modern building energy codes were born from the 1970s energy crisis, when the U.S. first recognized the need to make buildings part of the nation’s energy solution. Congress passed the Energy Conservation and Production Act of 1975, prompting ASHRAE to release Standard 90-1975, which was the first model energy standard for both residential and commercial buildings. What began as a response to oil shortages evolved into a national framework for improving efficiency, lowering energy bills, and creating healthier indoor environments.
Today, two model codes define energy performance in new construction: the International Energy Conservation Code (IECC), developed by the International Code Council (ICC), which applies to most low-rise residential buildings; and ASHRAE Standard 90.1, maintained by ASHRAE’s Standing Standards Project Committee 90.1, which governs commercial and multifamily buildings four stories and higher. Both are updated every three years through consensus-based processes that integrate advances in materials, technology, and design.
States adopt these model codes to establish consistent, verifiably effective standards for energy-efficient building design and construction. Using a national model allows jurisdictions to align with proven energy and cost savings while reducing the administrative burden of writing their own code from scratch. Each adoption cycle marks an opportunity to bring new buildings closer to the long-term goals of efficiency, affordability, and resilience.
Amendments
Once a model code is adopted, many states modify it through state-specific amendments that tailor how the code is applied or enforced. Amendments can adjust performance requirements or provisions to accommodate local market or climactic conditions.
States may amend for several reasons: to reflect regional climate, to balance cost and feasibility, or to harmonize with existing state policies. Some strengthen efficiency – tightening envelope requirements or improving lighting and controls – while others weaken it by relaxing testing standards or allowing lower equipment performance.
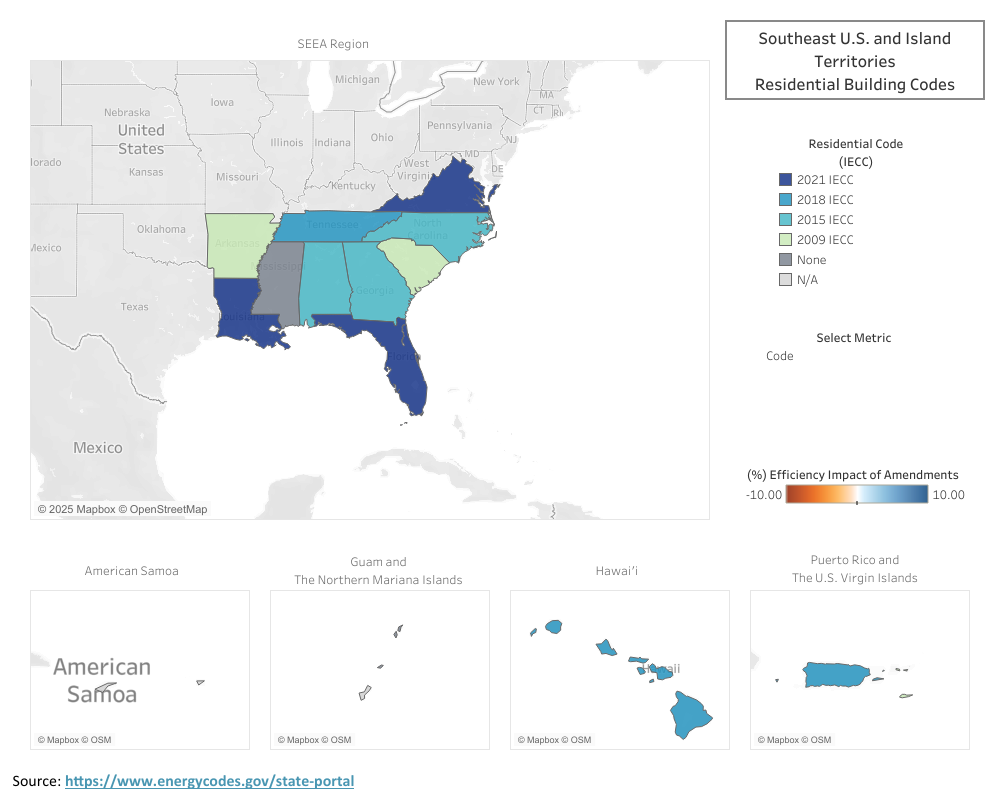
For example, several states in the Southeast have adopted the 2015 IECC with state-specific amendments, which in effect perform closer to the 2009 IECC. These amendments may often be created to help codes pass politically or reduce near-term costs, but often result in lower long-term energy and health benefits.
Impact of Amendments
On paper, a state’s code might appear to meet a recent national standard. In practice, however, amendments can significantly alter its strength, that is, the actual level of efficiency the code delivers. To capture this nuance, analysts from the U.S. Department of Energy’s Building Energy Codes Program use comparative modeling to estimate how amendments shift a code’s effective performance.
For example, a state that adopts the 2015 IECC but introduces multiple weakening amendments may, in effect, deliver energy savings closer to the 2009 IECC baseline. This map is intended to visualize those distinctions through both Code (what’s on the books) and Strength (what’s actually achieved), offering a clearer view of how policy choices translate into real-world outcomes for efficiency and affordability.
To learn more about the DOE’s State Energy Code modeling methodology, visit the link here.
The Impact (%) represents that estimated difference in energy performance caused by amendments alone – negative values indicate a weaker, less efficient code, while positive values reflect stronger-than-standard performance. Together, these measures show not just what code a state has adopted, but what level of efficiency it’s truly delivering.