
Month: September 2025
Buildings Blueprint Q3 2025

Resources
Regional News
- #25 – New Orleans, LA: 30.6 LEED-registered buildings per 10,000 housing units
- #21 – Arlington, VA: 52.2 per 10,000 housing units
- #17 – Alexandria, VA: 66.7 per 10,000 housing units
- #12 – Jacksonville, NC: 149.8 per 10,000 housing units
The authors concluded that cities with a high density of LEED certified buildings tend to have local policies or programs incentivizing energy-efficient buildings and local expertise to support program success. In addition, building portfolio owners with energy efficiency goals, such as universities and the military, also make a big impact.
These rankings show how sustainable construction practices are expanding across the Southeast, with both large and mid-sized cities demonstrating measurable progress in integrating energy-efficient design and construction into the built environment.
What SEEA Staff is Reading
Events
September Map of the Month
By Amy Lovell, Ph.D.
Solar Potential of Impervious Surfaces in the Southeast

Installation of solar photovoltaic panels on even a small fraction of the impervious surfaces in the urban environment in the Southeast could provide a significant boost in energy generation.
As solar photovoltaic technology has become increasingly affordable for electricity generation, both utility-scale and small-scale solar power (<1MW) have grown. Between June 2024 and June 2025, in the entire United States, solar power generation grew 25.4%. In the Southeast, Arkansas, Kentucky, Louisiana, and Mississippi all increased their solar power generation over 90% during the same period. This increase has raised questions about land use and the potential conversion of agricultural land into solar farms.
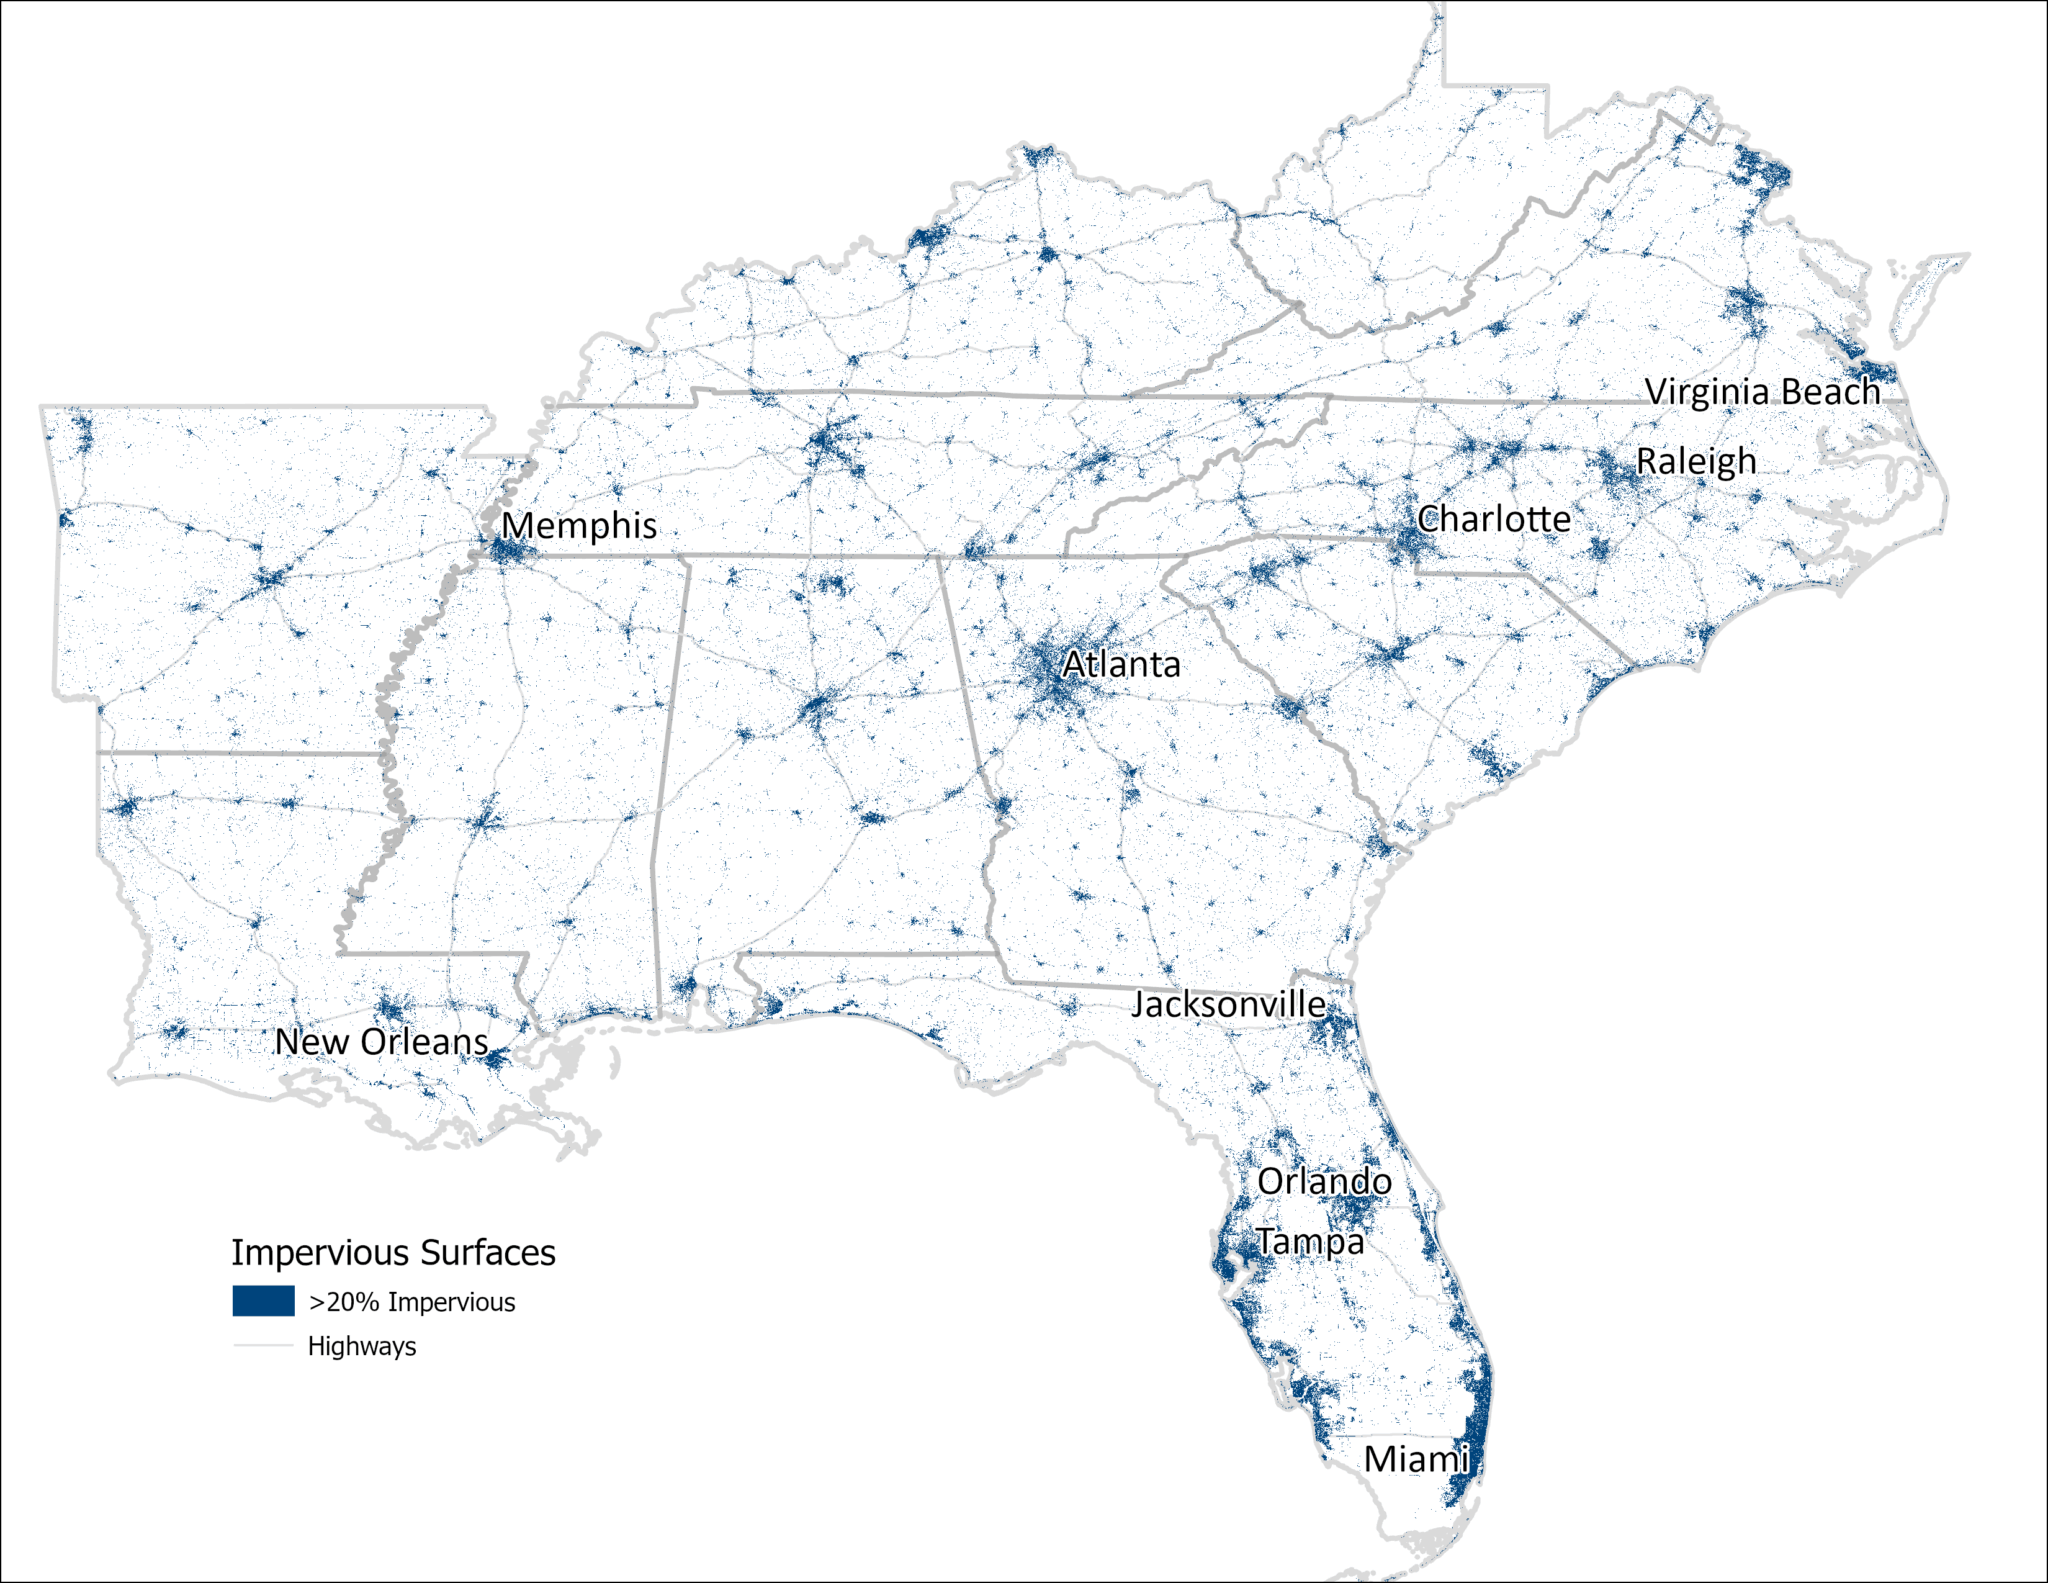
While the land area in use for solar power is a tiny fraction of the land in use as farms in the Southeast (and nationwide), it is worth considering what is the potential for solar power on land that is already in use. When land is covered with surfaces such as parking lots, buildings, sidewalks, and roads, water cannot effectively soak into the ground. When it rains, such impervious surfaces limit access to natural infiltration in the soil, which can lead to increased water runoff, flooding, and concentration of pollutants in streams and drinking water. Since solar panels are also impervious surfaces, placing them on rooftops and parking surfaces that are already in the built environment makes dual use of existing structures for supplementary power generation. In this map of the month, we highlight where the impervious surfaces are located in the Southeast and estimate the potential solar power generation capacity of these locations.
Using data from the U.S. Geological Survey National Land Cover Database, we determined the fractional surface area that is covered with artificial structures in our region. We sum the areas where the fractional impervious surface is greater than 20%, yielding 75,000 km2 of land area, shown in navy blue on the map below. Not surprisingly, the highlighted areas are primarily in urban areas and along major highways.
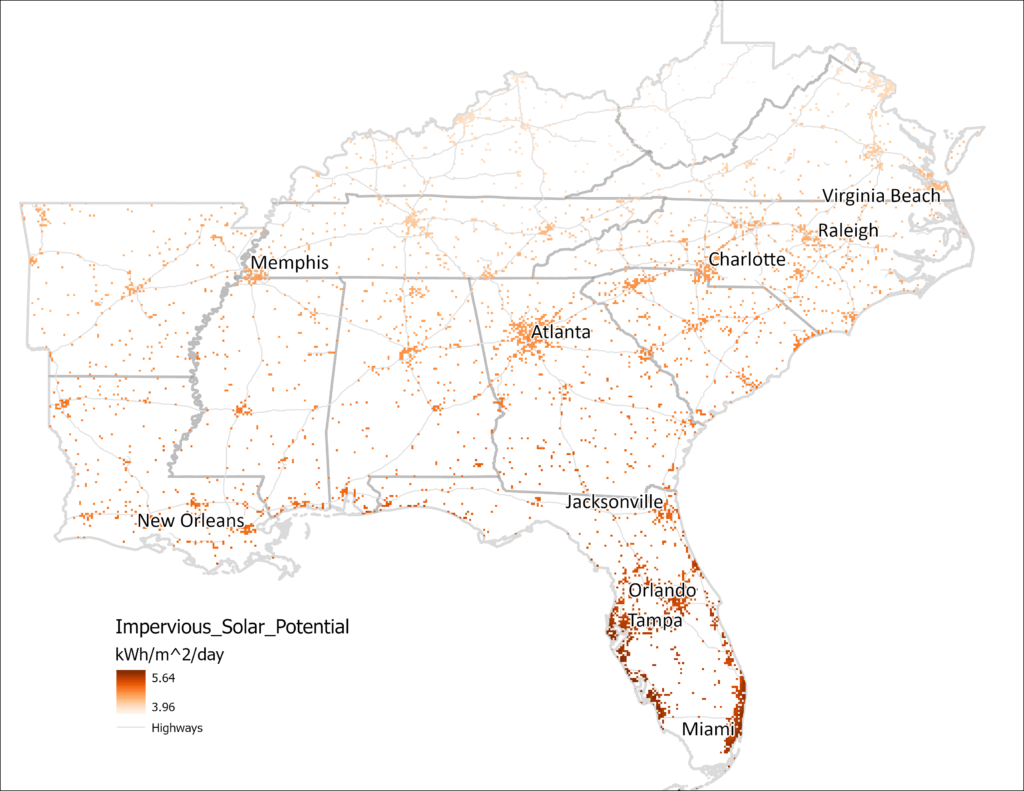
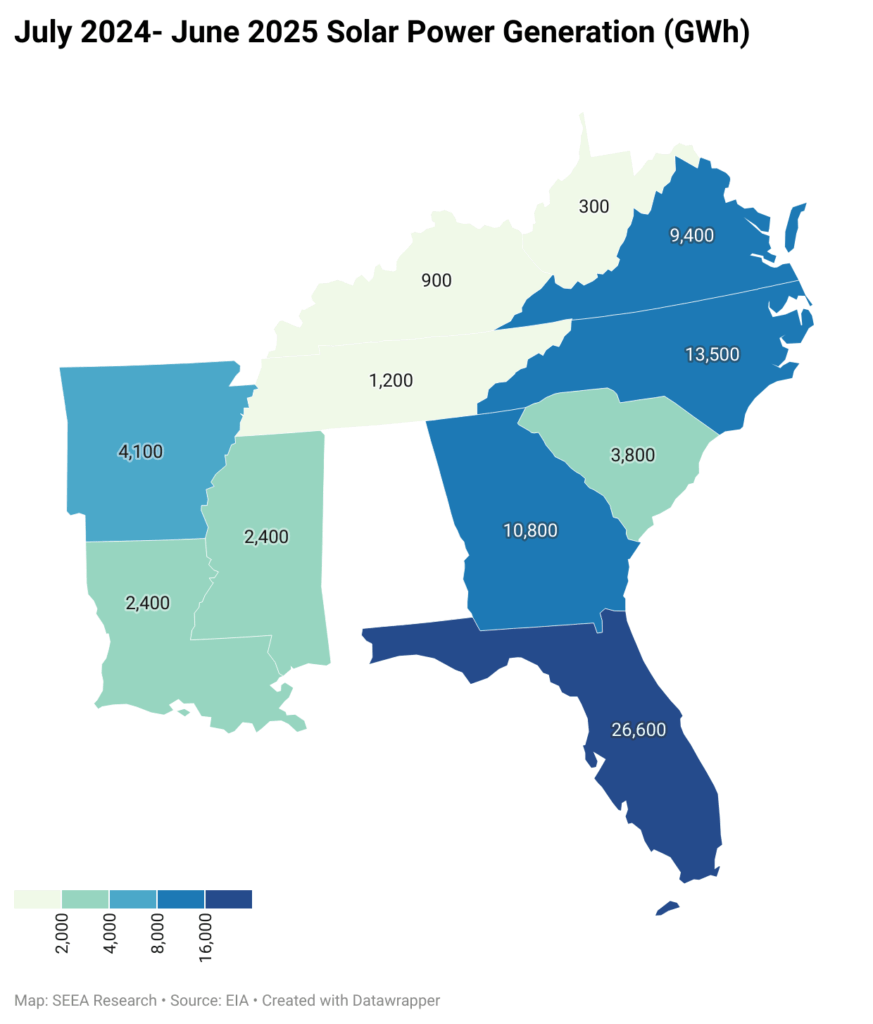
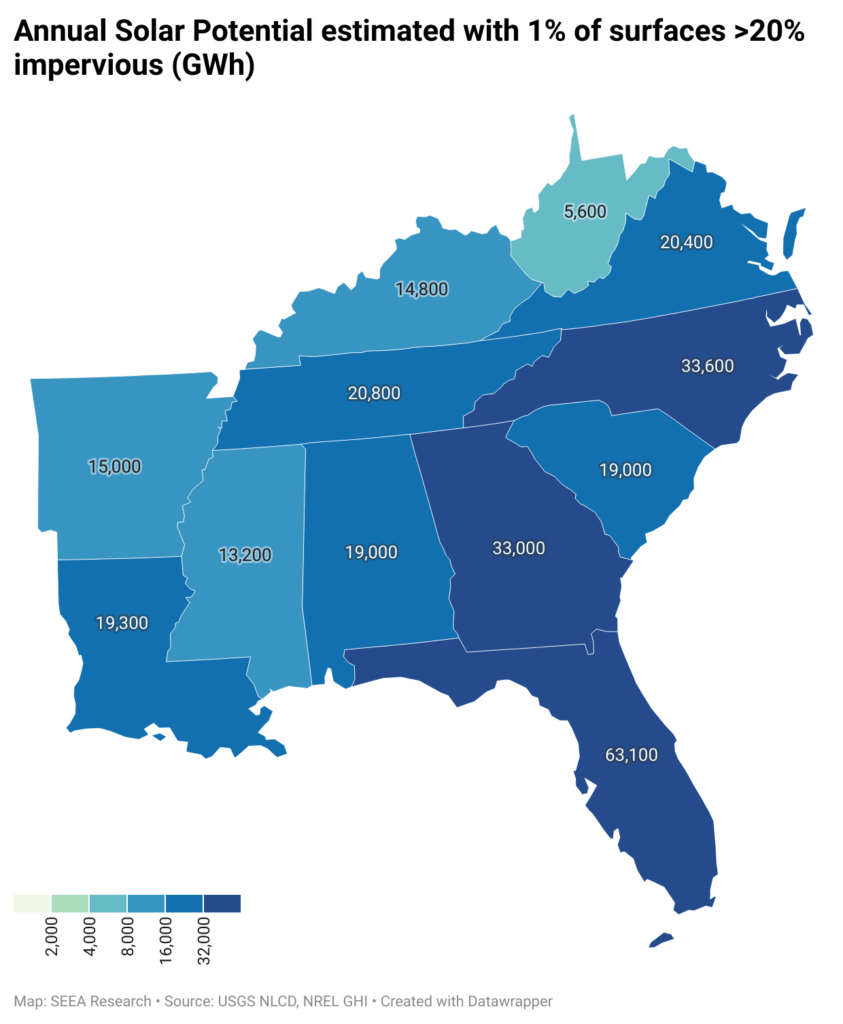
The National Renewable Energy Lab (NREL) provides estimates of the average potential for solar power using global horizontal irradiance (GHI), which is measured in kilowatt-hours (kWh) per square meter per day. In the Southeast, GHI varies approximately from 4-6 kWh/m2/day. If solar panels were deployed over even 1% of the (>20%) impervious surfaces on this map (185,000 acres or 750 km2), at 4 kWh/m2/day, with 20% panel efficiency, the region could generate 219,000 GWh annually. Compare this with 75,300 GWh already generated by solar facilities in these states between July 2024 and June 2025, this one percent could increase the region’s solar power contribution by a factor of 2.8, with enough to power 20 million homes, or approximately half of homes in these states.
Not all impervious surfaces are suitable for installation of solar panels, but adding panels to even a small percentage of the existing infrastructure could provide a significant additional source of electric power, without covering new land at all. This dual use of some of the urban built environment is equivalent to 400 farms at the 2022 average size of 463 acres each. Furthermore, solar panels on existing rooftops or parking lots provide artificial shade that can help to reduce the urban heat-island effect, offset peak electric power demand in urban areas where there is a lot of daytime power demand, and are more readily tied into existing grid infrastructure than panels in more rural areas.
August Map of the Month
By Laura Diaz-Villaquiran
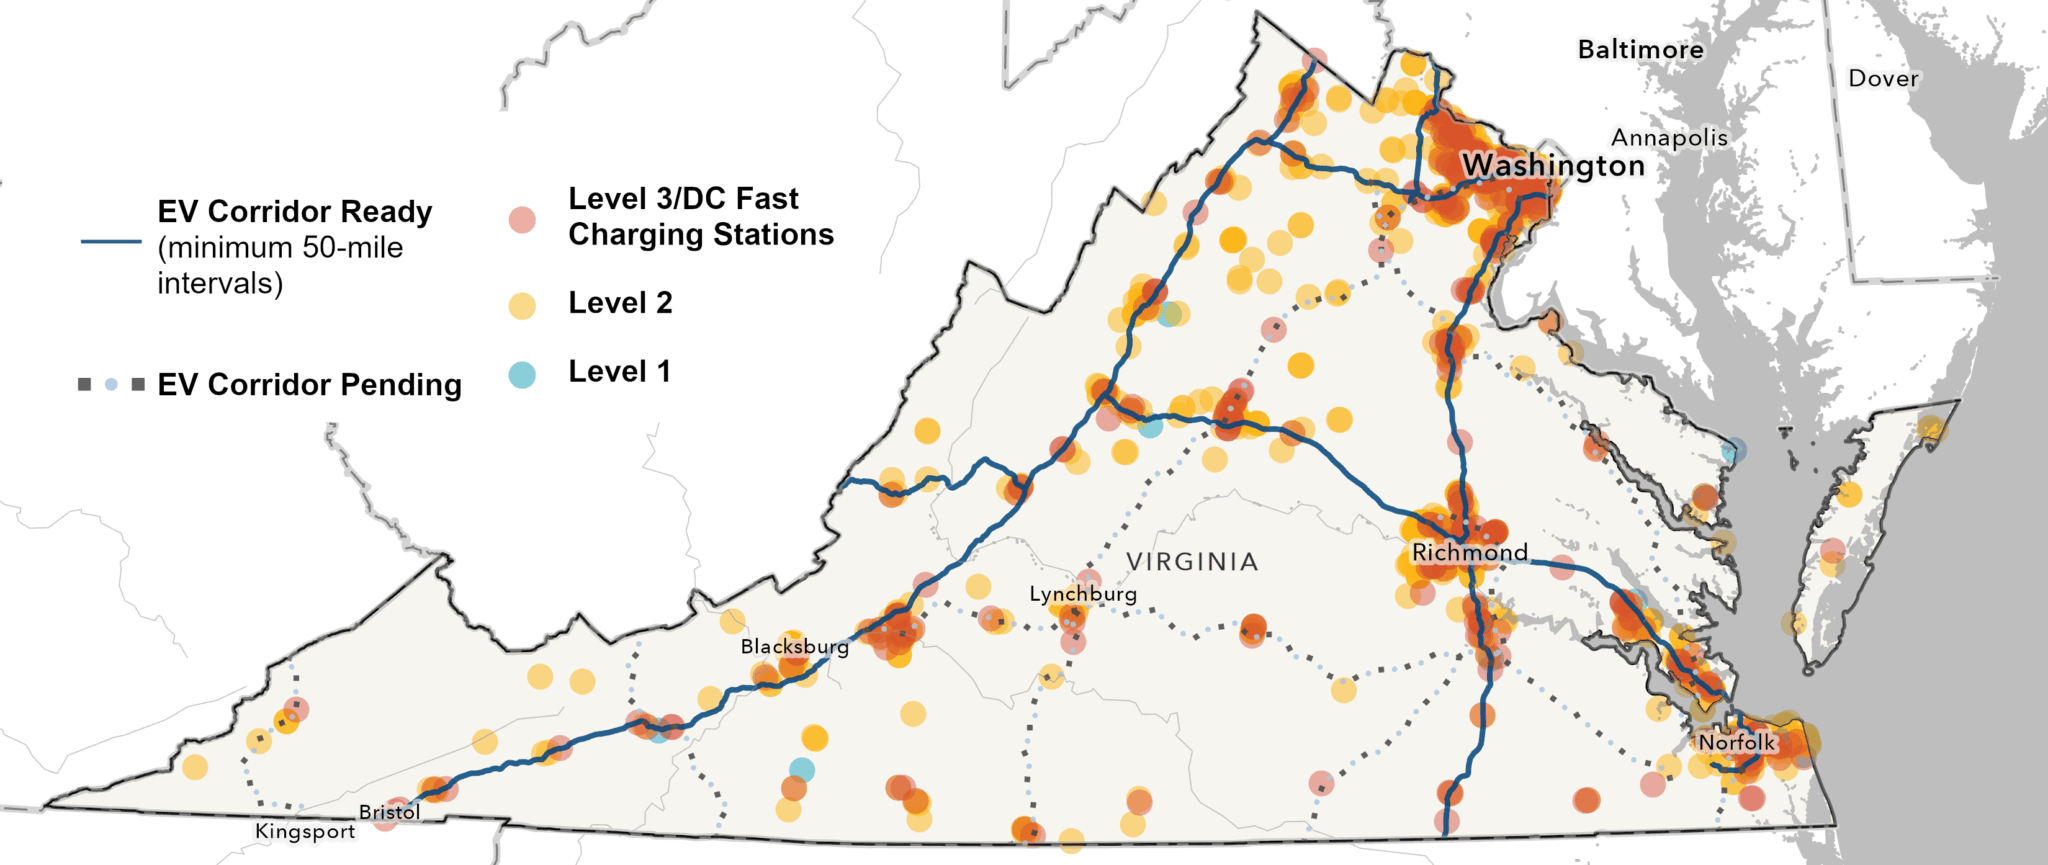
Public EV Charging Stations in the Commonwealth

Source: U.S. Department of Energy, Alternative Fuels Data Center
The U.S. EV charging network has grown from 5,070 EV charging ports in 2011 to more than 184,000 in 2023, a 36-fold increase in just over a decade. This rapid expansion is vital for consumers, who depend on reliable and accessible charging infrastructure. As the U.S. Department of Energy’s Alternative Fuels Data Center (AFDC) explains, while most drivers begin by charging at home or at fleet facilities, public and workplace stations, “help bolster market acceptance by offering more flexible charging opportunities at commonly visited locations.”
This Map of the Month highlights publicly available EV charging stations in the Commonwealth of Virginia, along with the state’s EV-ready and pending fuel corridors. Under the National Electric Vehicle Infrastructure (NEVI) program, previous guidance stated that stations must be located within 50 miles of one another to qualify as corridor-ready, but that has changed.
Virginia’s network is steadily taking shape. Today, the Commonwealth is home to 1,838 public EV charging stations, with a total of 5,316 charging ports. Of these, 344 are Level 3 direct-current (DC) fast charging stations, the highest-capacity chargers available. These stations make long-distance EV travel increasingly practical and reliable, with the AFDC noting that “DC fast charging equipment (typically a three-phase AC input) enables rapid charging along heavy traffic corridors at installed stations at power outputs up to 500 kW.”
Virginia’s interstates serve as a pass-through from the South to the Midwest and the Northeast, making this growing network especially significant for regional and national EV travel. Our map also indicates that charging “hot spots” are concentrated in Virginia’s urban areas, such as Arlington, Alexandria, Richmond, Norfolk, Lynchburg, and Blacksburg. These clusters highlight the state’s progress while underscoring the need to expand access in rural communities.
On February 6, 2025, the Federal Highway Administration (FHWA) announced a pause on the current NEVI Formula Program. But even with this pause, Virginians still have access to a wide range of residential and non-residential utility incentives that are helping to accelerate EV adoption:
- Appalachian Power offers time-of-use (TOU) rates for EV charging, rebates for Level 2 charging station purchases, and infrastructure support.
- Dominion Energy provides rebates and pilot programs for both residential and non-residential charging stations.
- Northern Virginia Electric Cooperative (NOVEC) and Rappahannock Electric Cooperative (REC) both extend TOU rate incentives to residential customers.
- Tennessee Valley Authority (TVA) supports non-residential adoption through rebates for DC fast charging station purchases, installation incentives, and deployment pilot programs.
Together, these programs make it easier for households and businesses to invest in charging infrastructure and alternative fuel options. For the most up-to-date information, the Alternative Fuels Data Center maintains a comprehensive directory of incentives, laws, and regulations available in Virginia.