June Map of the Month
By Elizabeth Willis
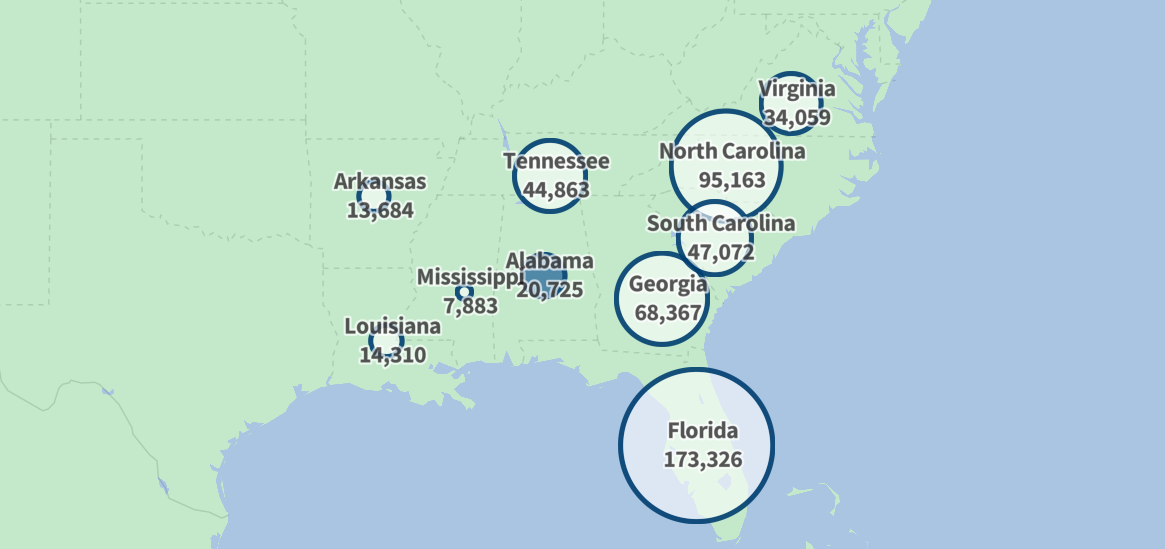
Map: Southeast Energy Efficiency Alliance (SEEA), Source: U.S. Census Bureau, U.S Department of Energy
Residential construction in the Southeastern United States has ebbed and flowed over the past three decades, shaped by economic cycles, population shifts, and policy changes. Among these influences, statewide updates to building energy codes have attracted growing attention. Do they meaningfully affect construction activity? Or are their effects overstated?
This month’s map looks at the relationship between residential building activity and the implementation of statewide energy codes across the region. As the Southeast continues to experience high rates of population growth and demand for affordable, resilient housing, policymakers and industry professionals should consider how residential energy efficiency measures can be advanced without constraining development.
Using information from the U.S. Census Bureau’s Building Permits Survey (BPS), this month’s map displays the annual number of new, privately-owned, single-family residential building permits issued in each Southeastern state from 1995 through 2024. Overlaid on this time series are blue-flashing indicators marking the years when each state adopted a new or updated version of its residential building code. By visualizing these two datasets together, the map offers a regional snapshot of how construction activity has evolved over time—and whether building code updates influence permit volumes.
The Building Permit Survey (BPS) data used here is publicly available through the U.S. Census Bureau and represents an estimate of new residential building permits. It does not include information on renovations, remodeling, or additions. The intent of this visual is to observe large-scale trends in Southeastern states and contextualize them within the timeline of code adoption.
Most Southeastern states have updated their building energy codes at least once – often multiple times – since 1995. Yet in nearly all cases, these updates do not correspond with sharp declines in new residential construction. In fact, building permit volumes often continue to rise even after major code adoptions. The one clear and dramatic exception is the 2008 housing market crash, which triggered a steep regional decline in permit numbers. However, that downturn was rooted in macroeconomic instability, not regulatory change or code updates.
State-by-state patterns provide further texture. Florida, for instance, consistently shows the highest permit volumes in the region, driven in part by sustained population growth. North Carolina stands out for its triennial code update cycle, which has not hindered its steady stream of residential development. Even in states that have adopted relatively stringent codes – such as Georgia or Virginia – there is no evidence to suggest a long-term construction suppression following code implementation.
The data suggests that these impacts do not translate into a slowdown of regional construction. Instead, residential construction activity remains largely robust, even through multiple rounds of code revision. The dominant influences on residential construction activity are market-driven: availability of financing, consumer demand, labor supply, and broader economic health.
Ultimately, statewide energy code updates, though sometimes perceived as a potential hindrance to development, have not restrained residential construction in practice. Policymakers and industry professionals should consider this perspective when evaluating future code proposals and updates. While regulation warrants scrutiny, the data in this map suggests that energy codes have largely coexisted with a robust, responsive housing market in the Southeastern United States. Alongside sustained patterns of residential growth, building energy codes are a key tool for advancing public health, safety, and affordability. By establishing minimum standards for ventilation, insulation, and mechanical systems, these codes improve indoor air quality, reduce risk of respiratory illness, increase comfort, and lower energy burdens. Over the lifespan of a home, they also yield significant cost savings for residents by improving efficiency and reducing utility bills (NEEP, 2021).
SEEA has previously published The Economic Impact of Commercial Energy Codes in the Southeast, which found that stronger codes do not significantly hinder commercial construction. You can access the full report here.